On Saturday 21 October, T-MAPY special analytical maps helped TV Nova (the most popular TV station in the Czech Republic, part of the Time Warner group), political experts and citizens to better understand the results of Czech legislative election 2017 in a very high geographic detail - for the first time in more than 14.000 voting districts.
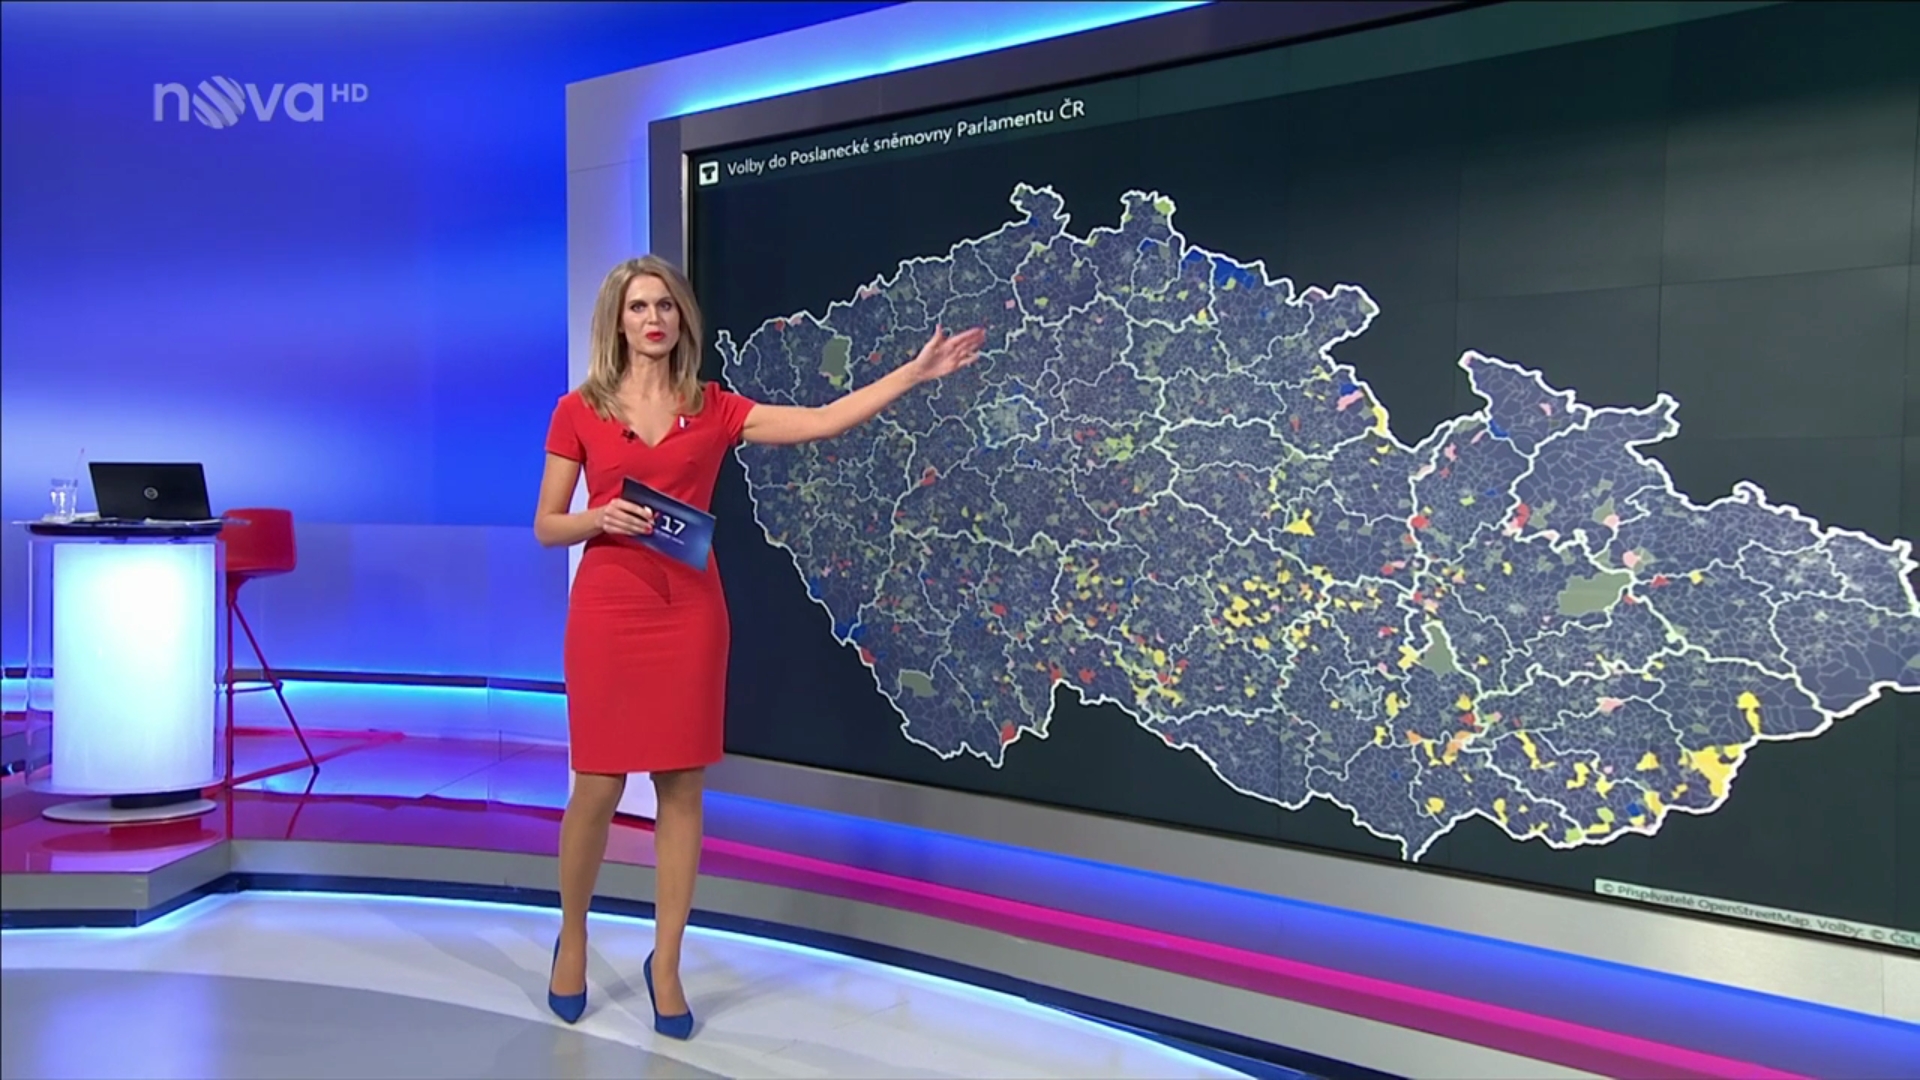
Our analytical maps helped to visualize results during the day and enabled to compare current results with the results from elections in 2013.
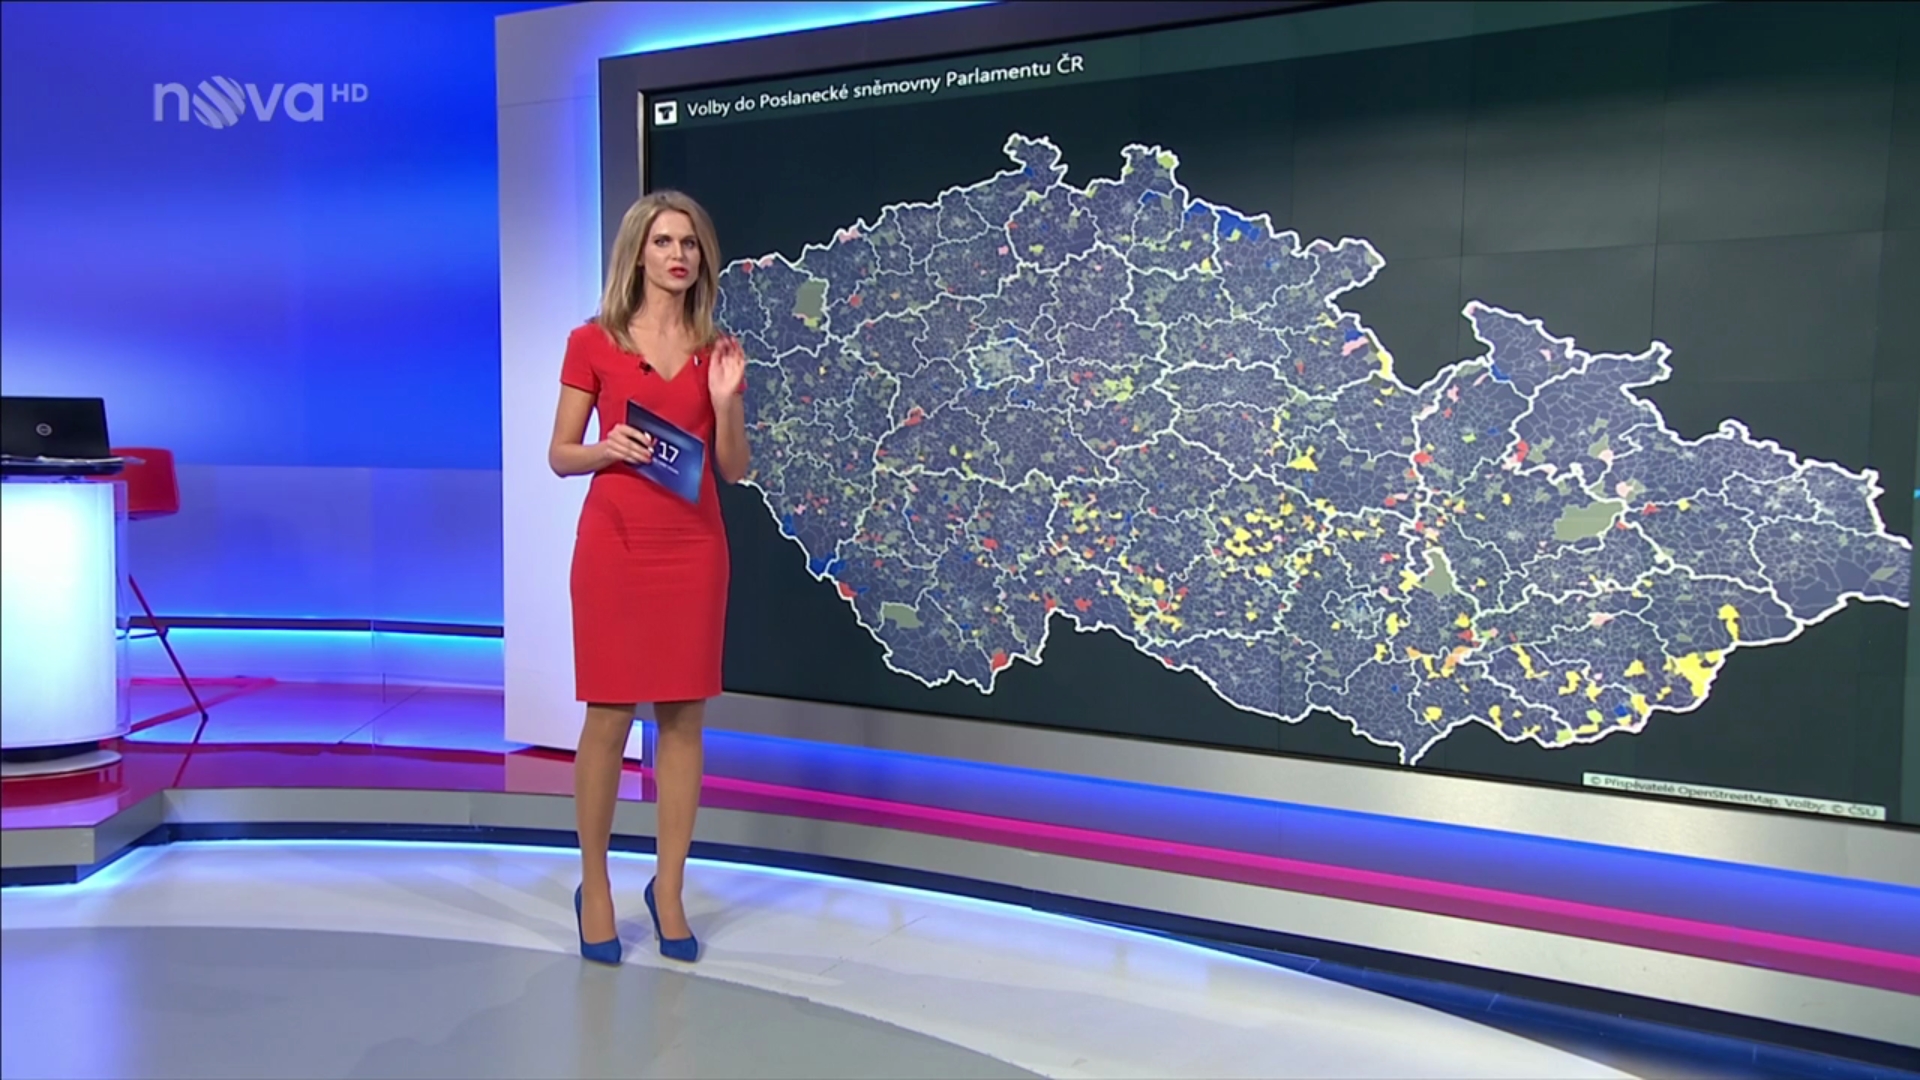
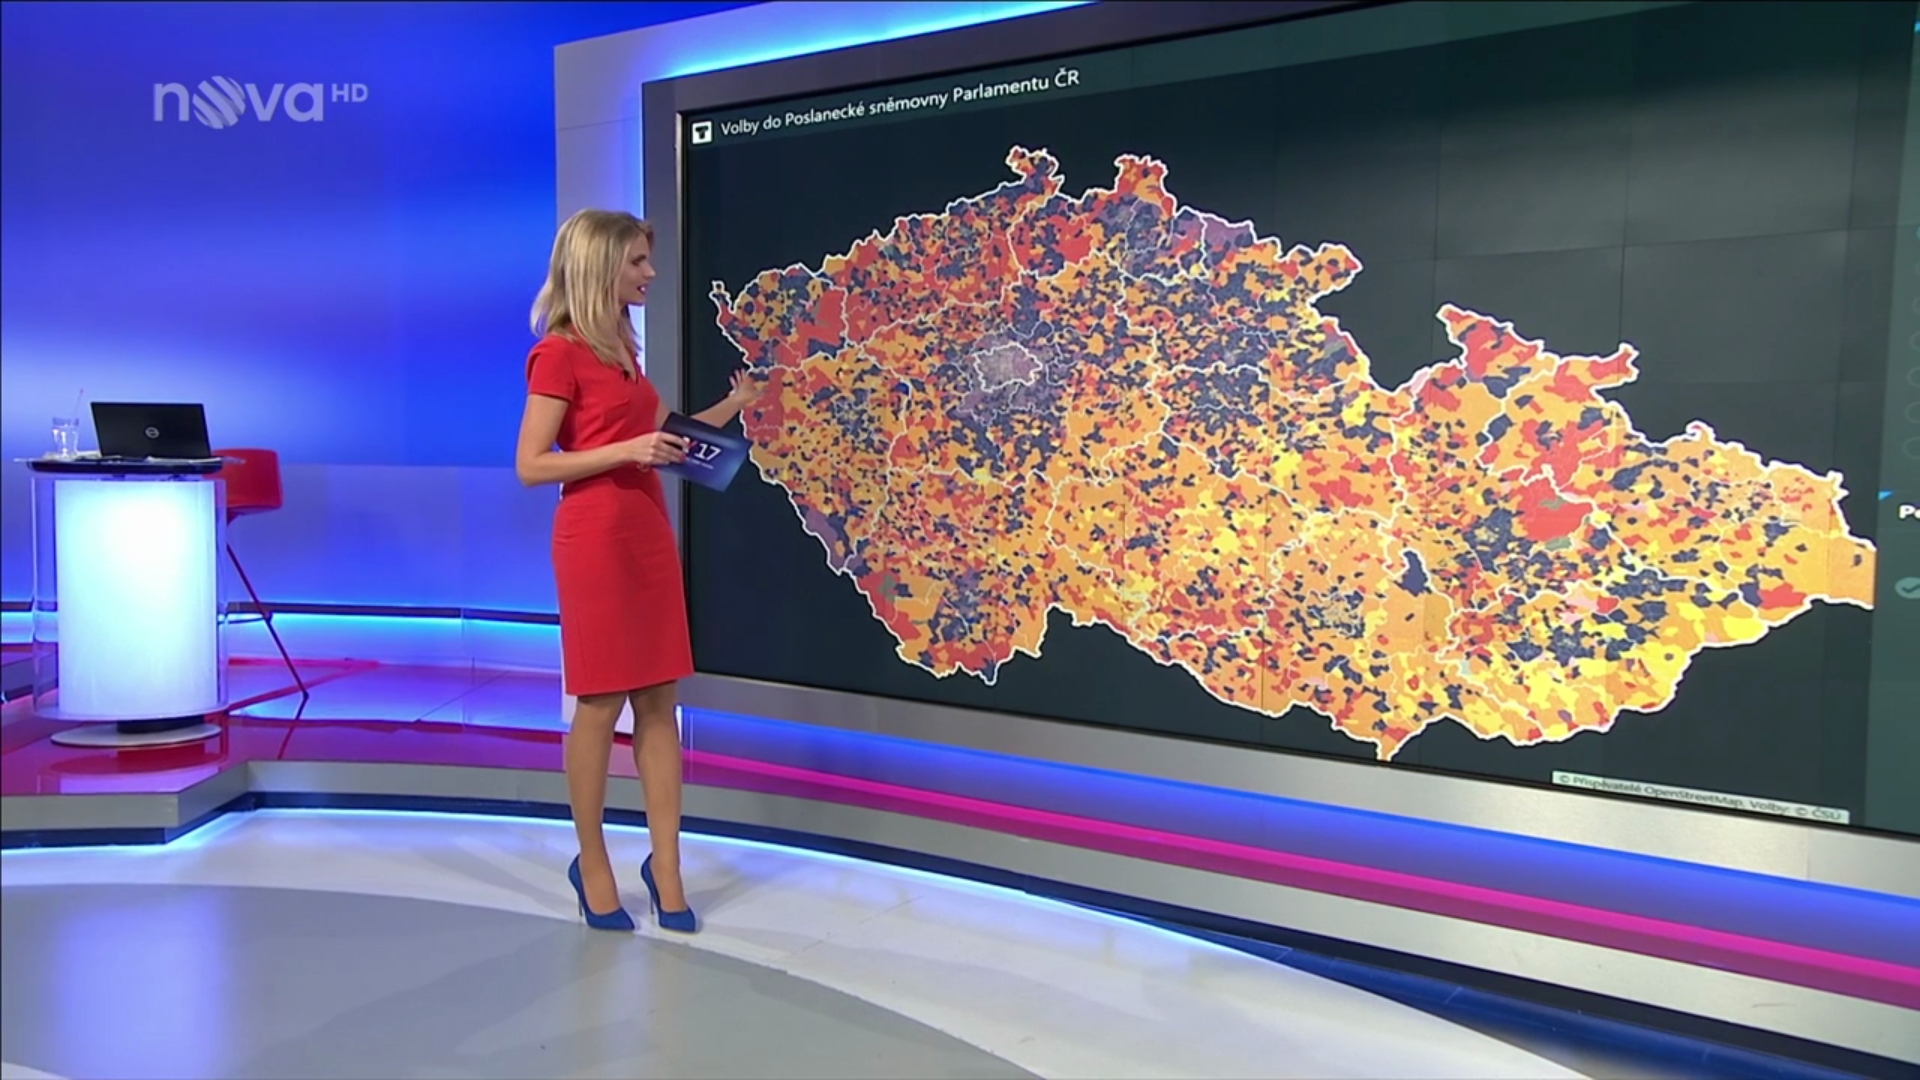
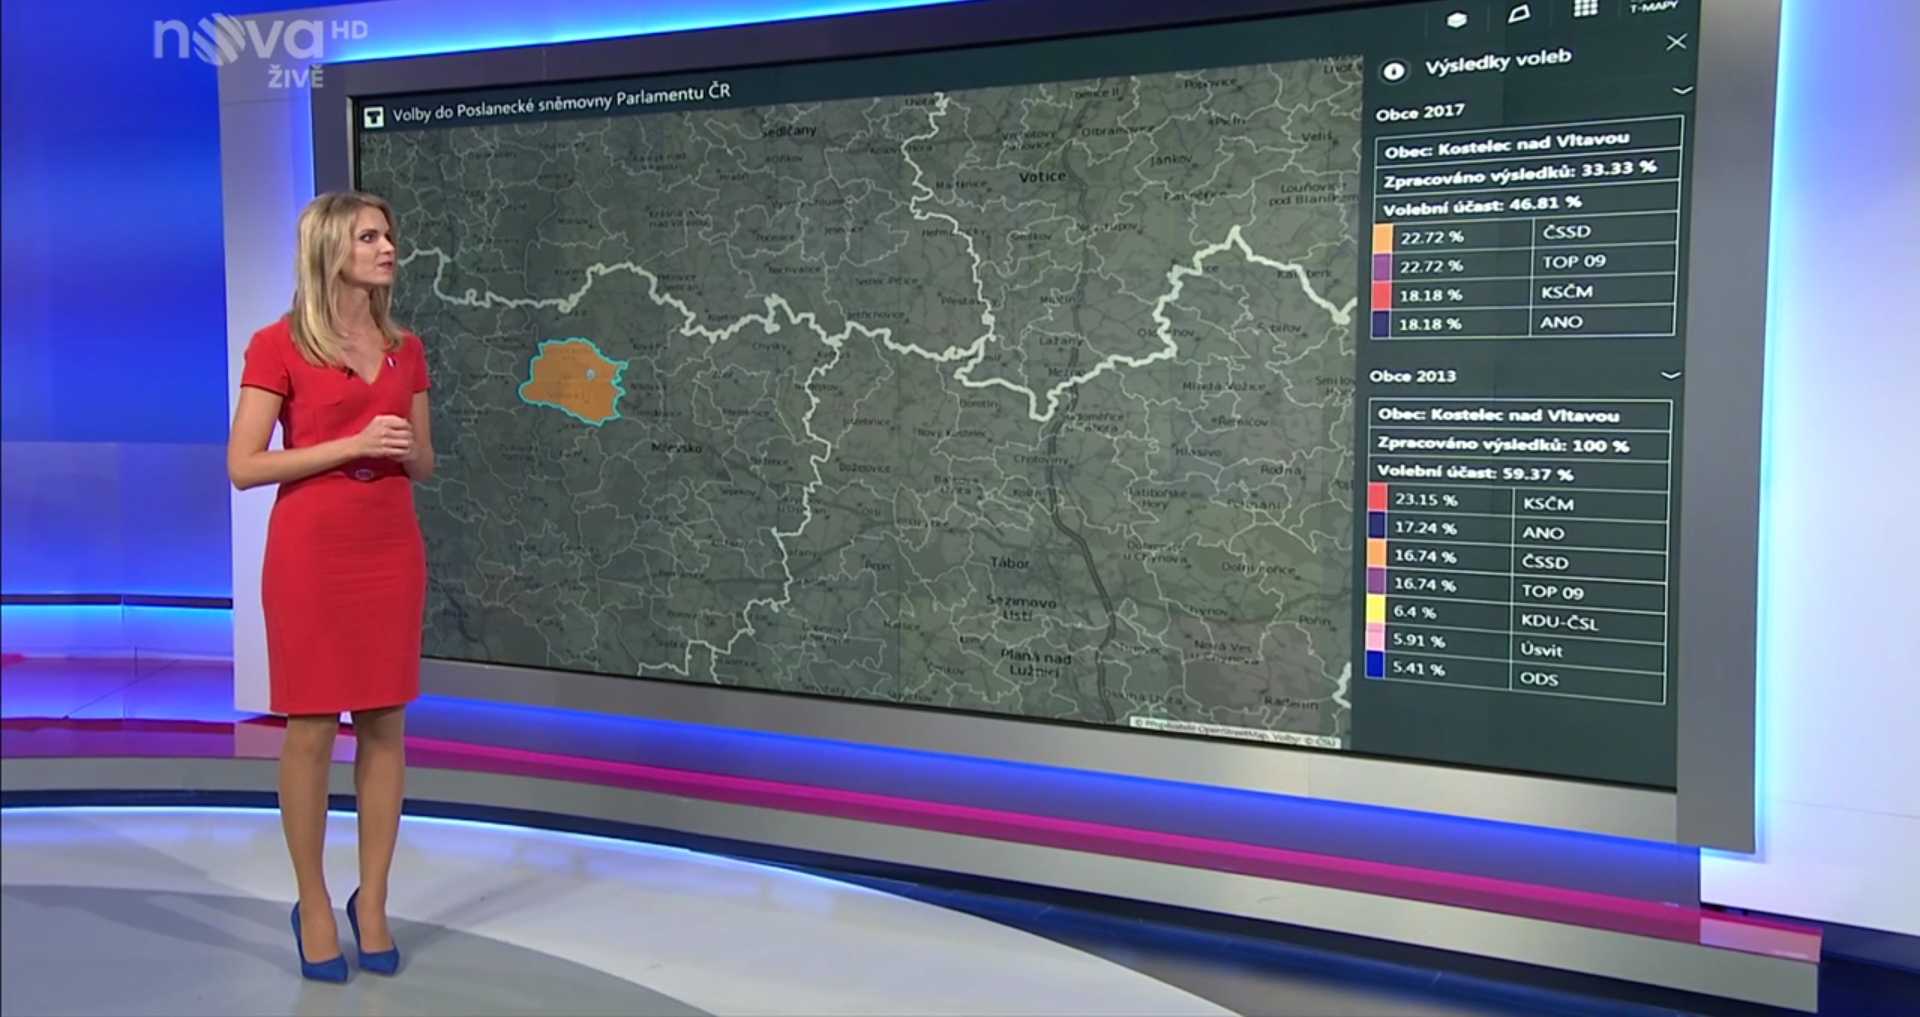
The anchorwoman was able to zoom in the interactive map on the touch screen in order to explore the election results in detail and explain why different political parties won in different voting districts in each city.
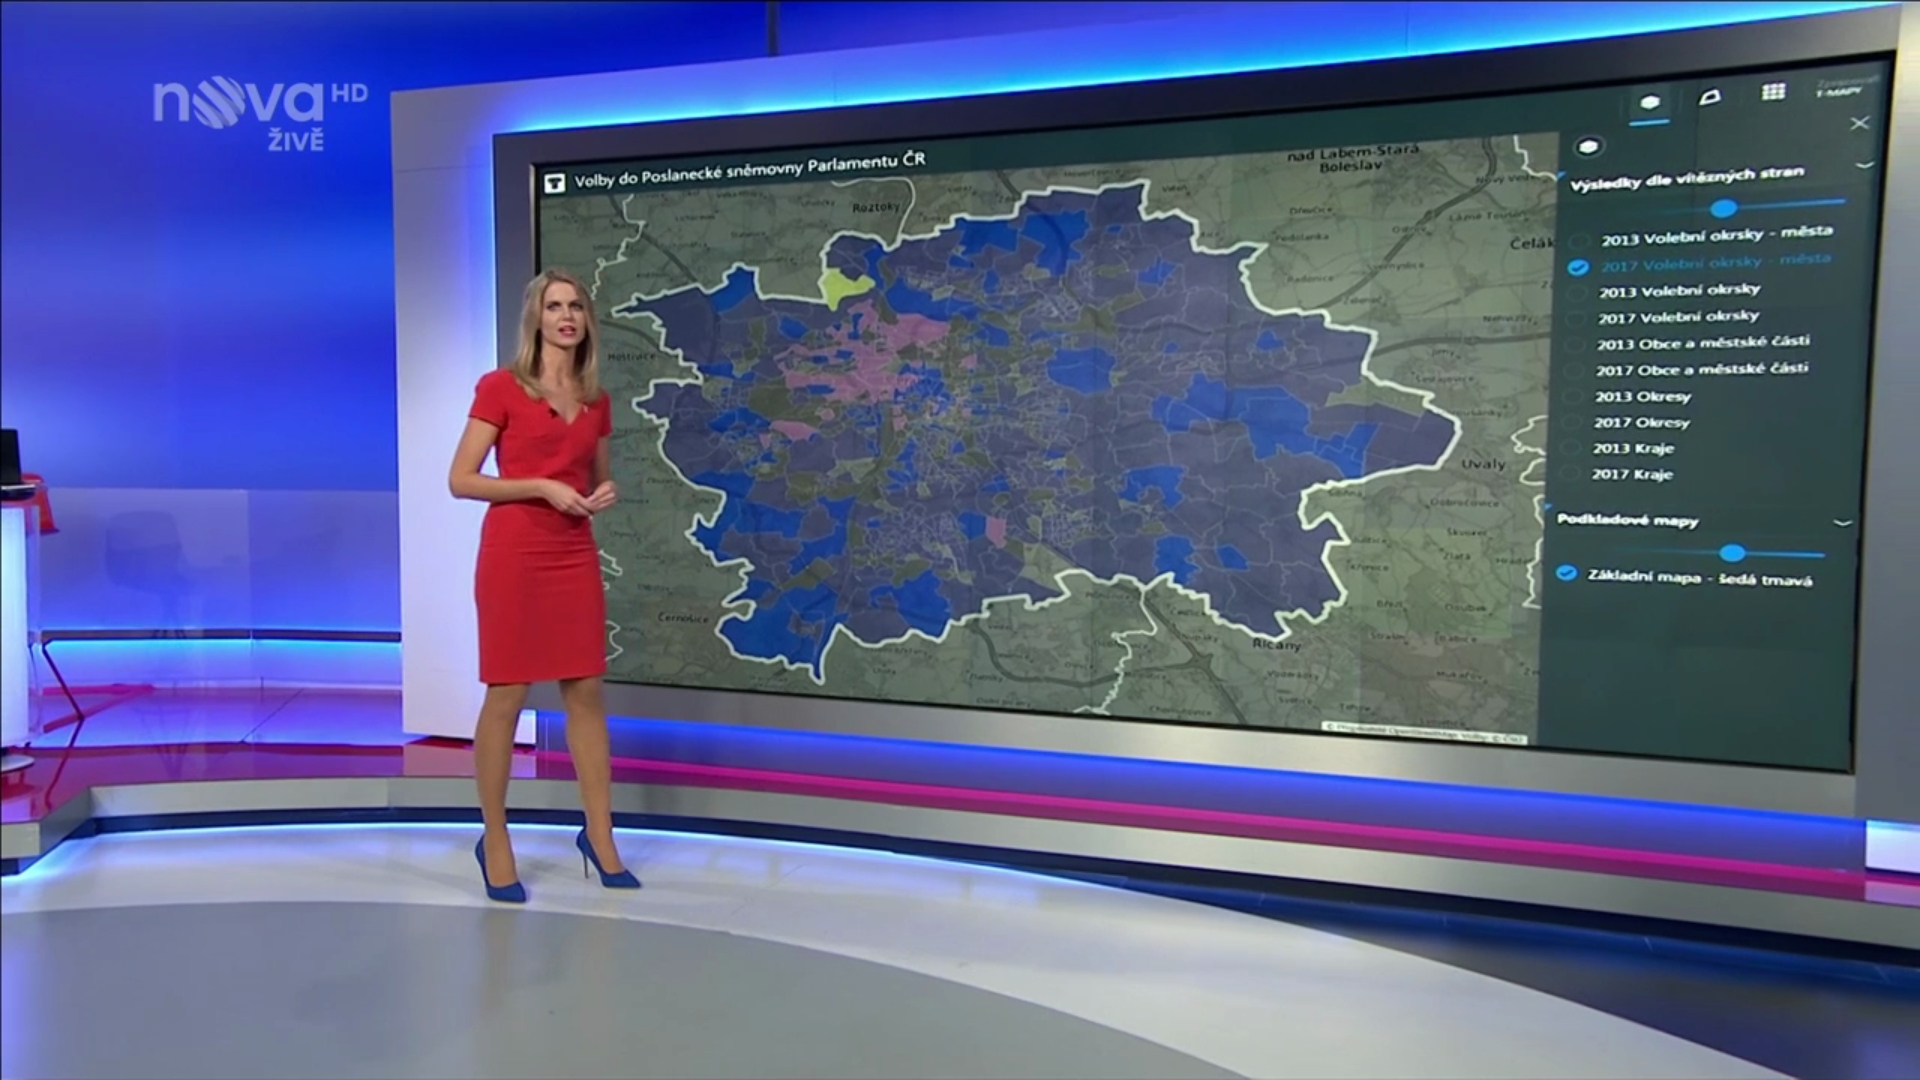
The T-MAPY system behind received data from Statistical Office every 30 seconds and immediately showed them on the map (a winning political party in a particular voting district) and in the detailed table with voter turnout and results in a voting district.
T-MAPY analytical maps can be used for visualizing and analyzing any data from smart city sensors, operations, customers, finance and marketing to get a deep understanding of the world around you including your business, market and opportunities. You can even integrate these maps with your system (e.g. CRM/ERP/BI) to get all the important data, analysis and information (spatial and non-spatial) in one place.
Are you interested in T-MAPY GIS and Geospatial solutions, technologies, innovations and would like to become our partner? Contact us.