Corpis Maps Release Notes - November 2018
The new version is out and it is full of new amazing features based on users' feedback from all around the world!
"The new features make Corpis Maps the very unique product in the market. The platform now enables to read the data from GIS systems and Spatial Asset Management systems, analyze business data in new innovative ways, and present and share the analytic maps throughout the organization in customizable outputs. The new version is all about the highest quality and comfort for map creators and end users." said Jaroslav Polacek, Corpis Maps Product Manager.
GeoEnrichment
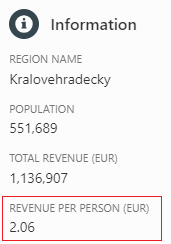
Use your own data along with the official government statistics of administrative areas (e.g. demographic data) to get an even better insight in the market behaviour and trends, and your sales performance and potential.
Example: Revenue Per Person = Total Revenue / Population
User-defined Spatial Filter
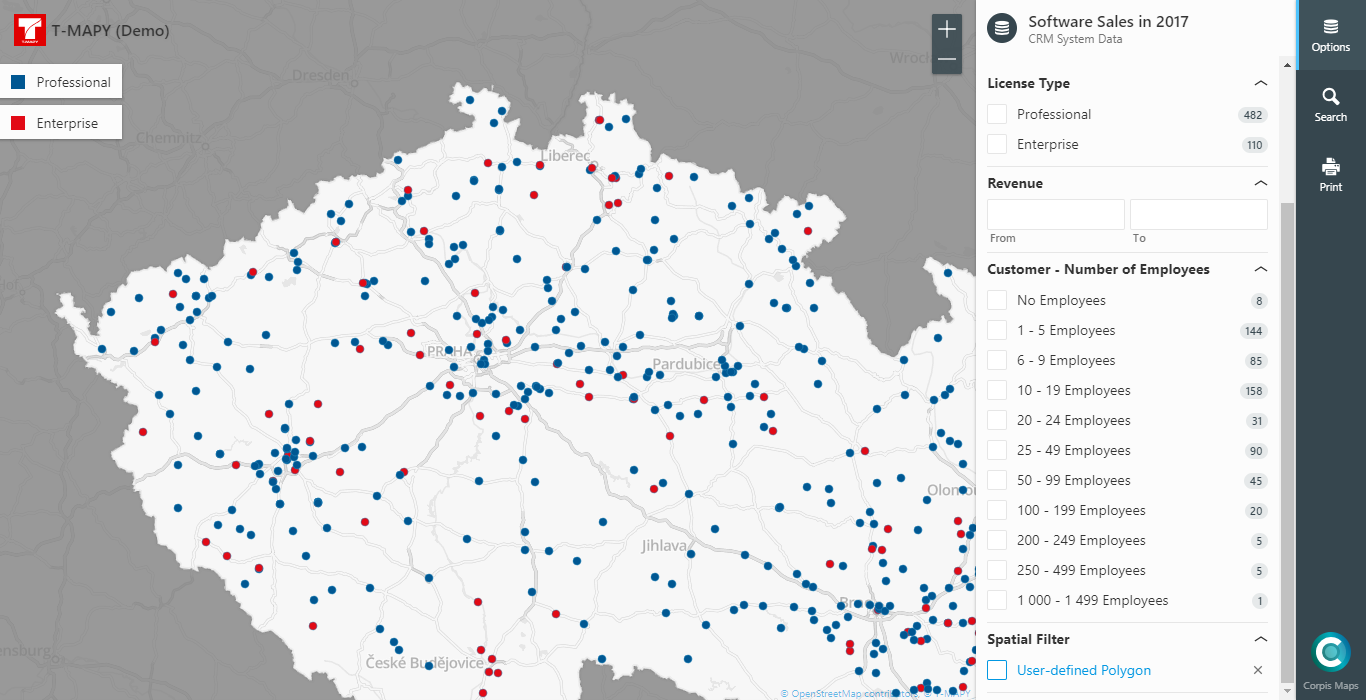
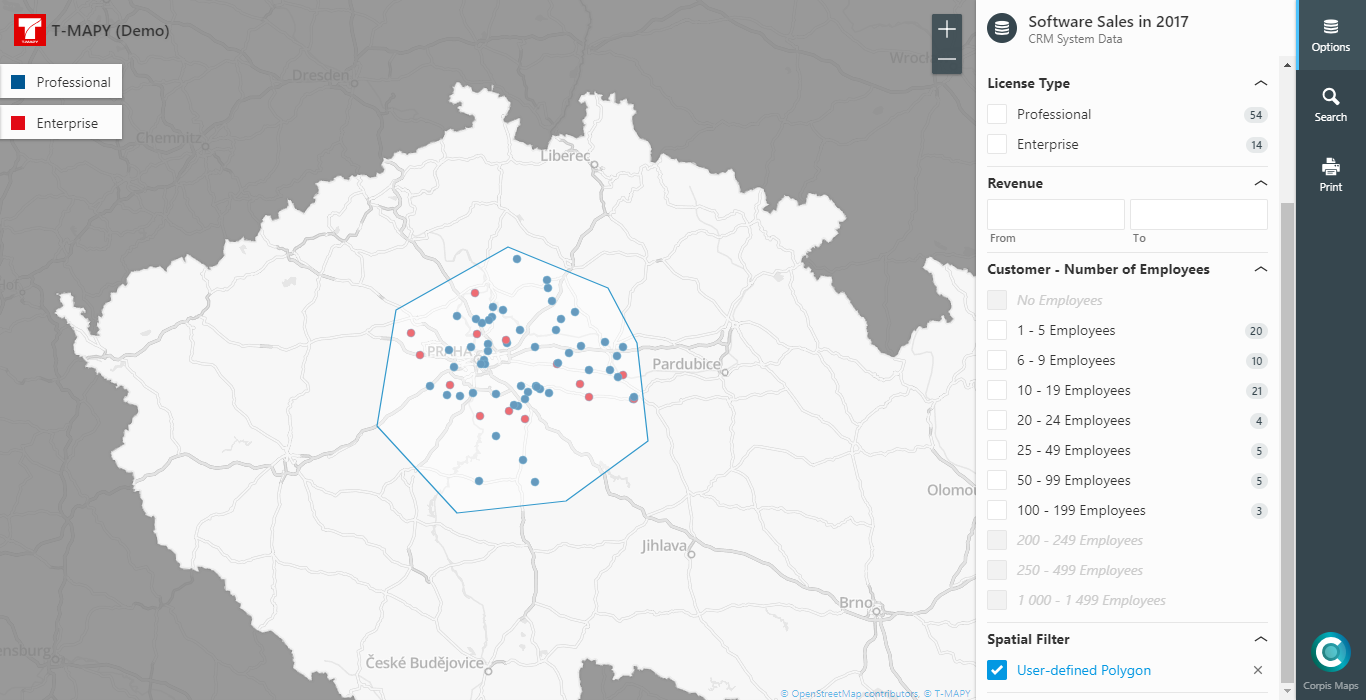
The user-defined spatial filter helps you to interact with a map in a brand new way. Draw a polygon and adjust the polygon shape at any time based on your needs during the session. This feature enables you to analyze a user-defined area of interest. You will use it for example if you are thinking of restructuring your sales regions. Live Demo >
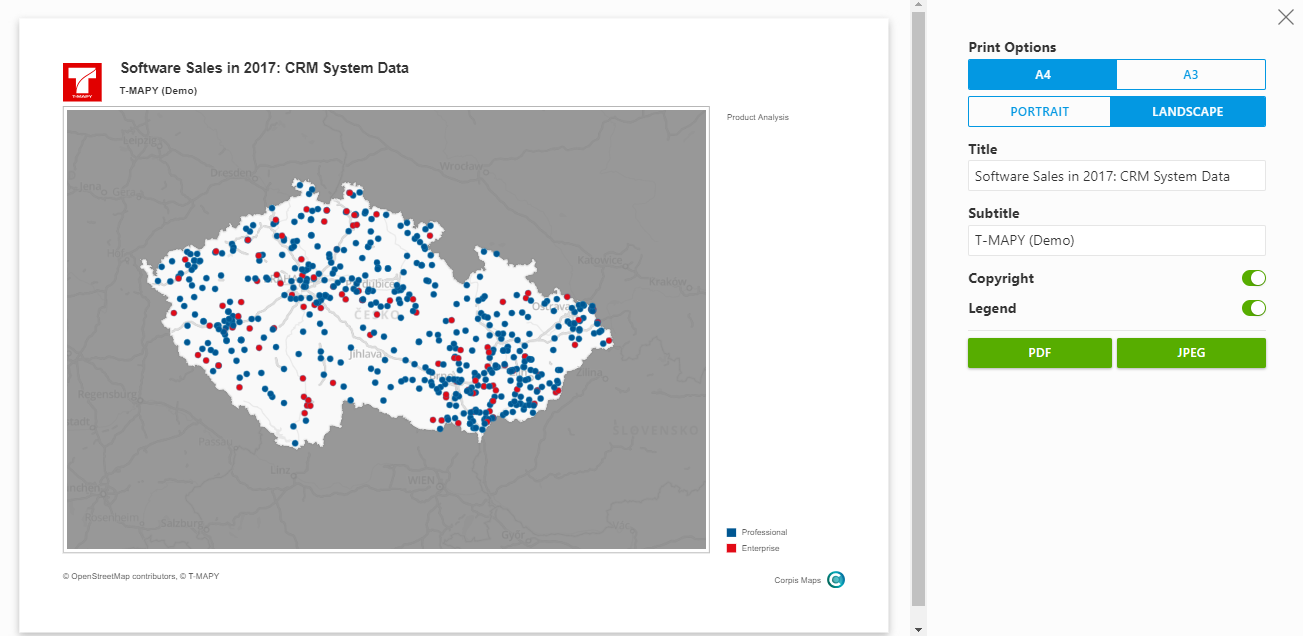
Print
New interactive print feature makes it super easy to print out the analytic map to PDF or JPEG including the list of filters. You can even zoom in/out or move the map in the map window. If you don't want to share the live map with others, you can bring a paper map (with the same information value) with you to the meeting or simply attach the analytic map in PDF or JPEG to your email. Live Demo >

Custom Intervals
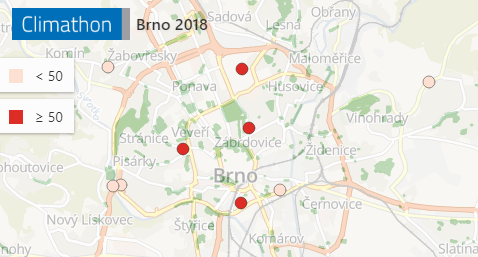
If you need to analyze the data in particular numeric intervals, now you can using the "Custom Breaks" option in the Visualization section of the map configuration. Live Demo >
Map Configuration Import and Export
From now you don't need to create a map configuration file manually. When you finish your map configuration in Corpis Maps Creator, simply click the "Export" button.

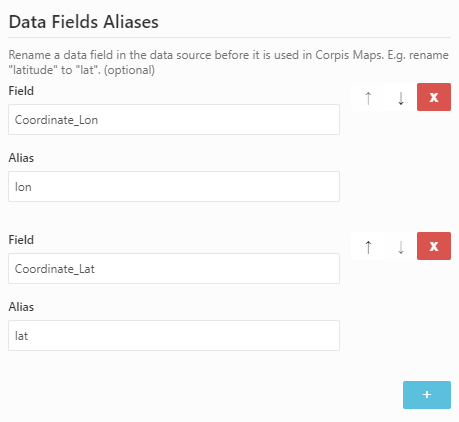
Data Field Alias
Corpis Maps requires the coordinates in the "lat", "lon" fields. If you use different names of these fields in the raw data, it is no longer a problem. Simply rename them in the "Data-Table" section in Corpis Maps Creator.
Search
Corpis Maps now shows the first 100 records matching the search string. The more letters you type, the more accurate results you get.

GeoJSON Support
GeoJSON format support means the instant access to wide range of data from the GIS systems and Spatial Asset Management systems including T-MAPY Assetino Professional and Premium. It has never been easier to create custom spatial analyses of your assets for decision makers.

Other Features and Improvements
Vector basemap support, Corpis Maps Creator user interface improvements, identification by tokens, performance improvements.
All Corpis Maps Integration Partners, Solution Partners and clients have immediate access to this new version of Corpis Maps. For more information about Corpis Maps or live demos, visit the official product website:
Are you interested in a Corpis Maps demo with your own data?
Contact us at marek.lesak@tmapy.com (Marek Lesak).
