corpis-maps-web

Corpis Maps v2 - Release Notes November 2018

Corpis Maps Release Notes - November 2018

The new version is out and it is full of new amazing features based on users' feedback from all around the world!

"The new features make Corpis Maps the very unique product in the market. The platform now enables to read the data from GIS systems and Spatial Asset Management systems, analyze business data in new innovative ways, and present and share the analytic maps throughout the organization in customizable outputs. The new version is all about the highest quality and comfort for map creators and end users." said Jaroslav Polacek, Corpis Maps Product Manager.
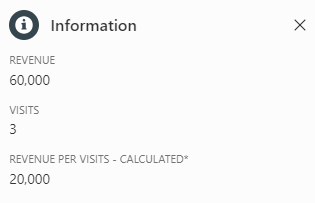
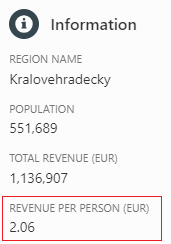
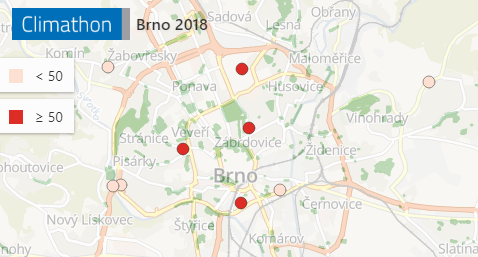

GeoEnrichment
Use your own data along with the official government statistics of administrative areas (e.g. demographic data) to get an even better insight in the market behaviour and trends, and your sales performance and potential.

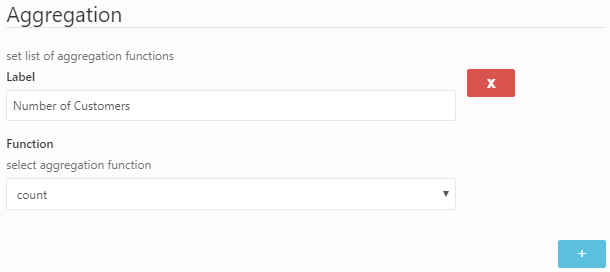
Example: Revenue Per Person = Total Revenue / Population

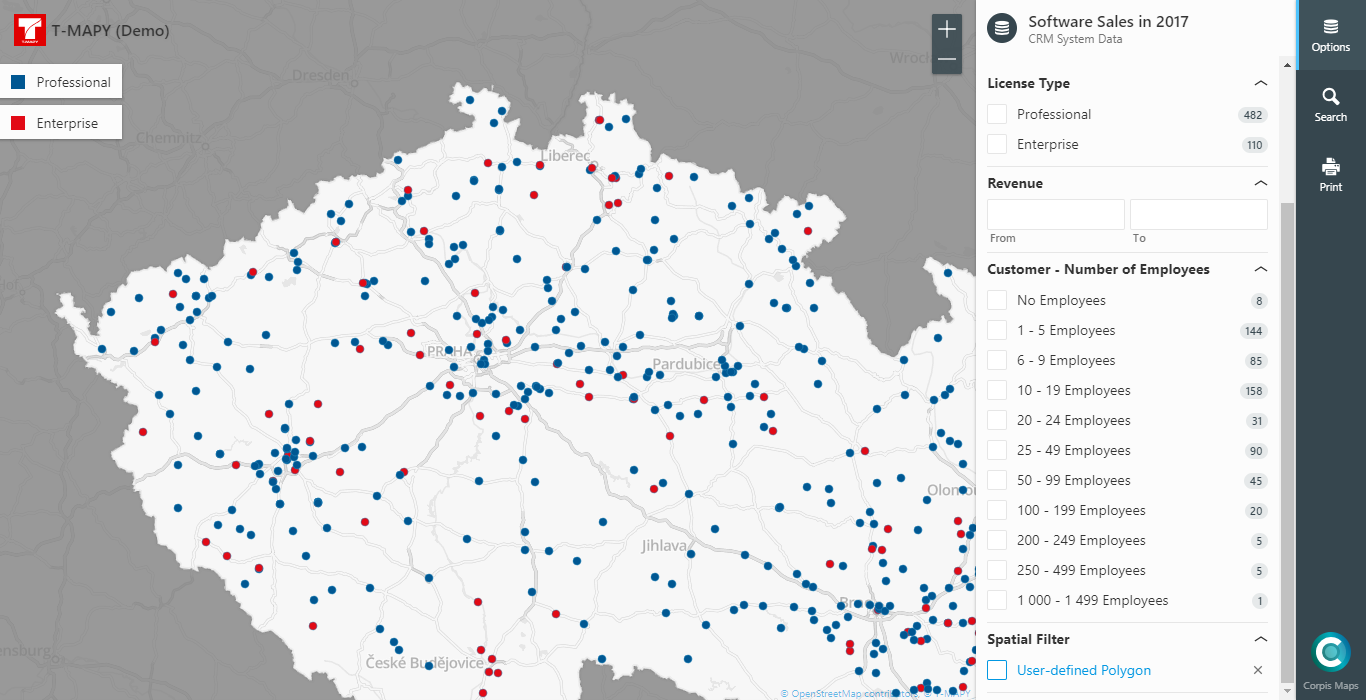
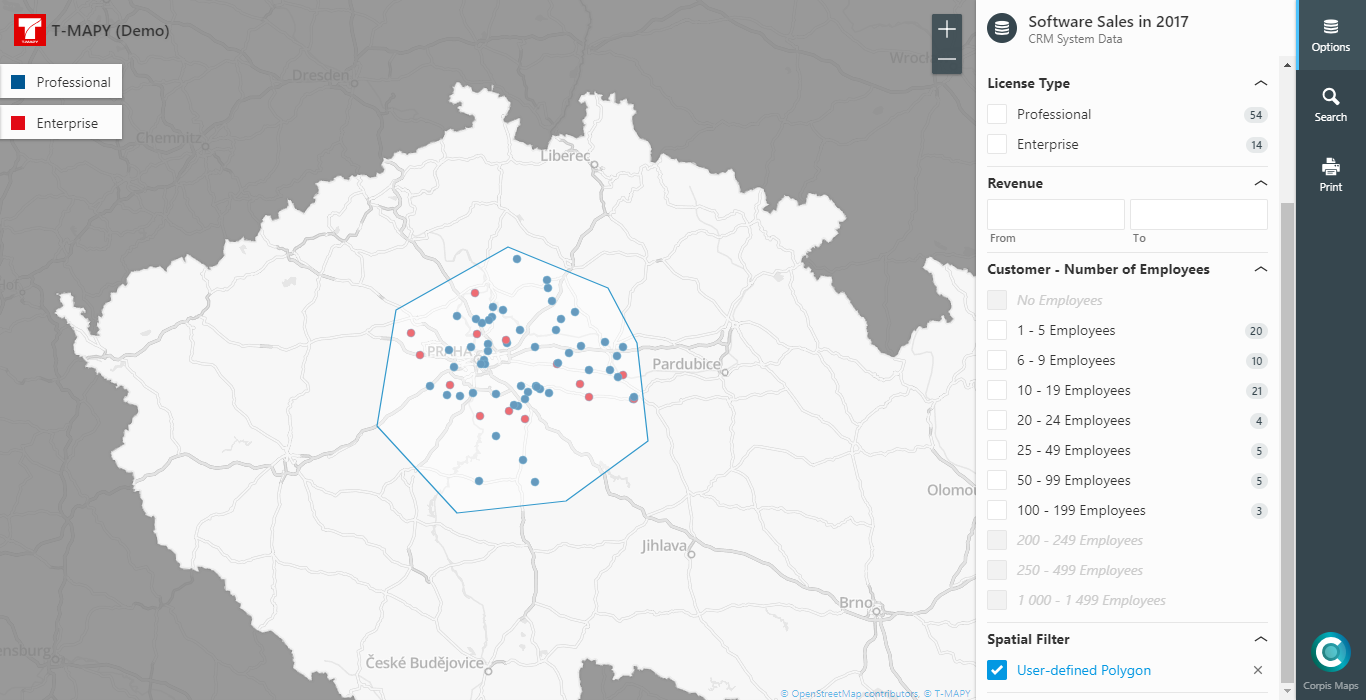
User-defined Spatial Filter
The user-defined spatial filter helps you to interact with a map in a brand new way. Draw a polygon and adjust the polygon shape at any time based on your needs during the session. This feature enables you to analyze a user-defined area of interest. You will use it for example if you are thinking of restructuring your sales regions. Live Demo >
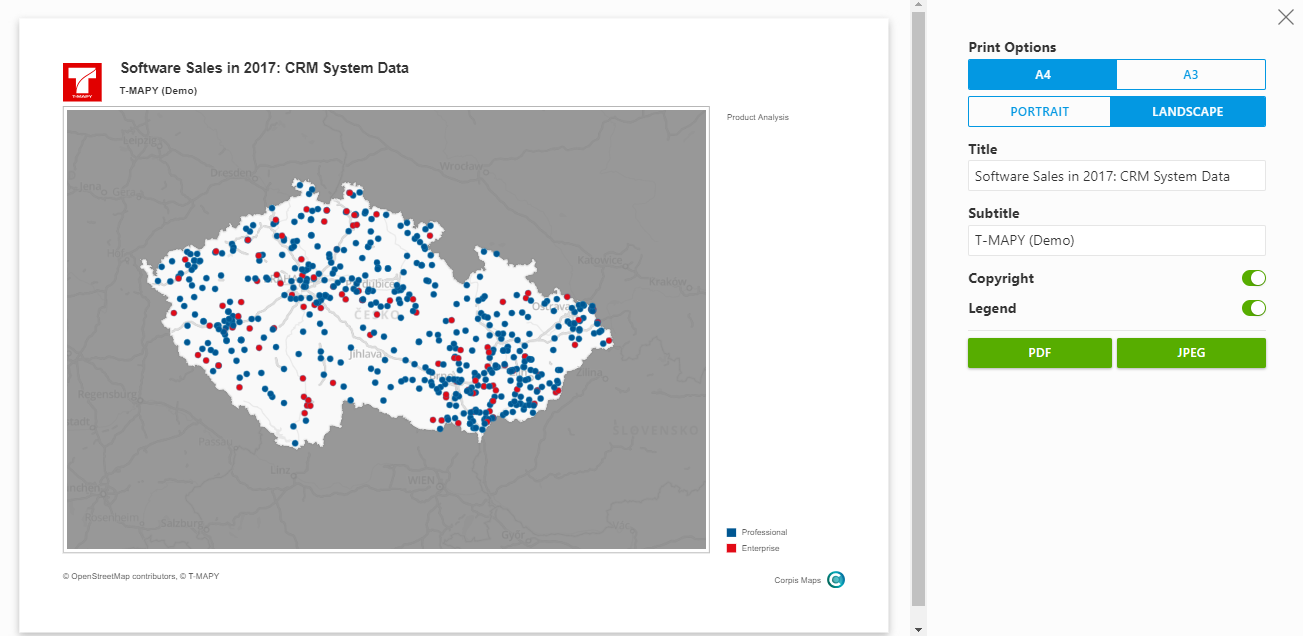
Print
New interactive print feature makes it super easy to print out the analytic map to PDF or JPEG including the list of filters. You can even zoom in/out or move the map in the map window. If you don't want to share the live map with others, you can bring a paper map (with the same information value) with you to the meeting or simply attach the analytic map in PDF or JPEG to your email. Live Demo >
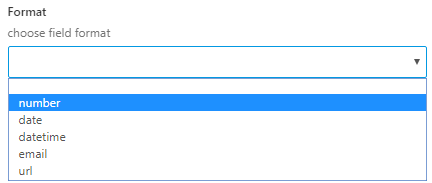
Custom Intervals
If you need to analyze the data in particular numeric intervals, now you can using the "Custom Breaks" option in the Visualization section of the map configuration. Live Demo >

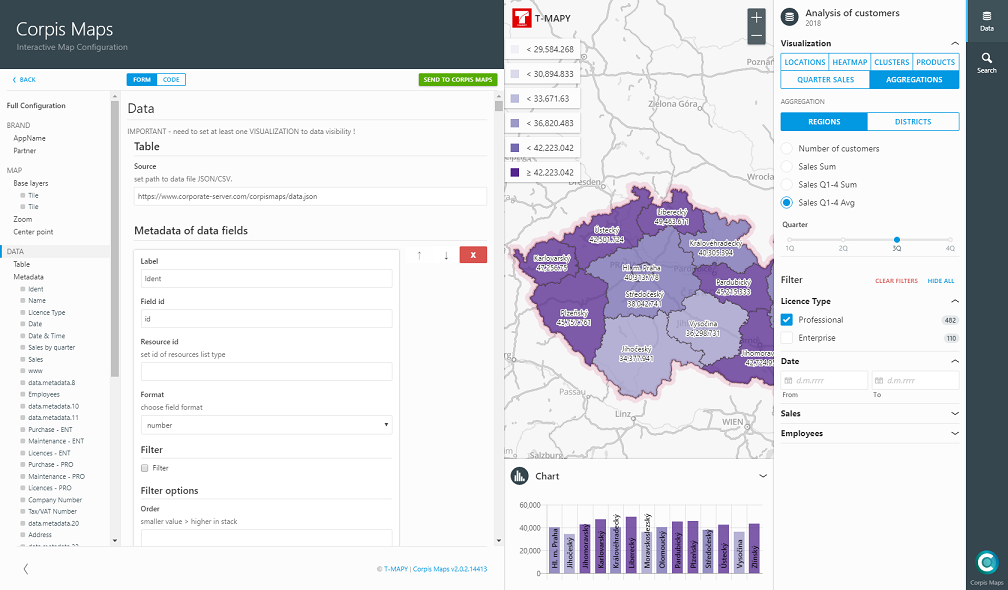
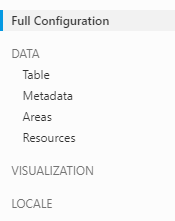
Map Configuration Import and Export
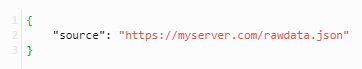
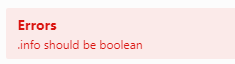
From now you don't need to create a map configuration file manually. When you finish your map configuration in Corpis Maps Creator, simply click the "Export" button.
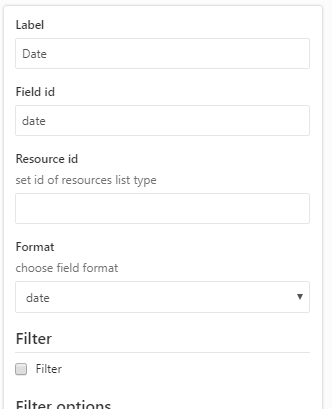
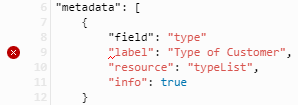
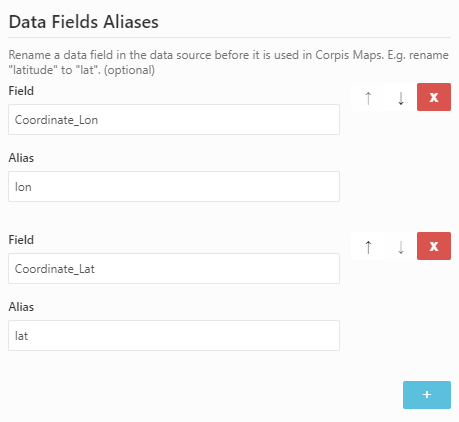
Data Field Alias
Corpis Maps requires the coordinates in the "lat", "lon" fields. If you use different names of these fields in the raw data, it is no longer a problem. Simply rename them in the "Data-Table" section in Corpis Maps Creator.
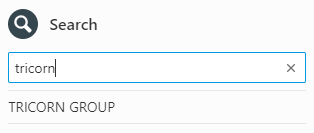
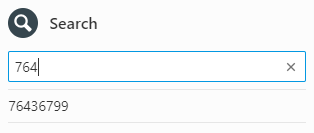
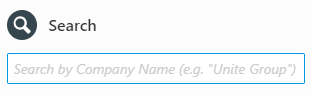
Search
Corpis Maps now shows the first 100 records matching the search string. The more letters you type, the more accurate results you get.
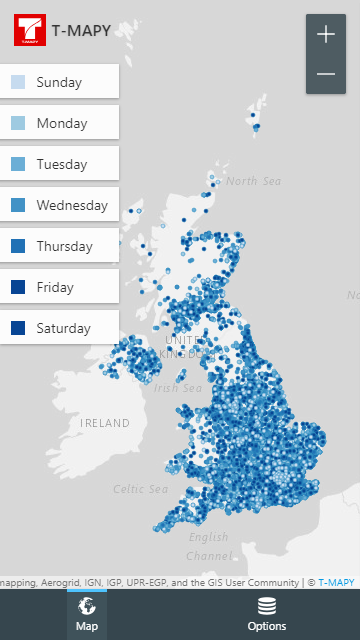
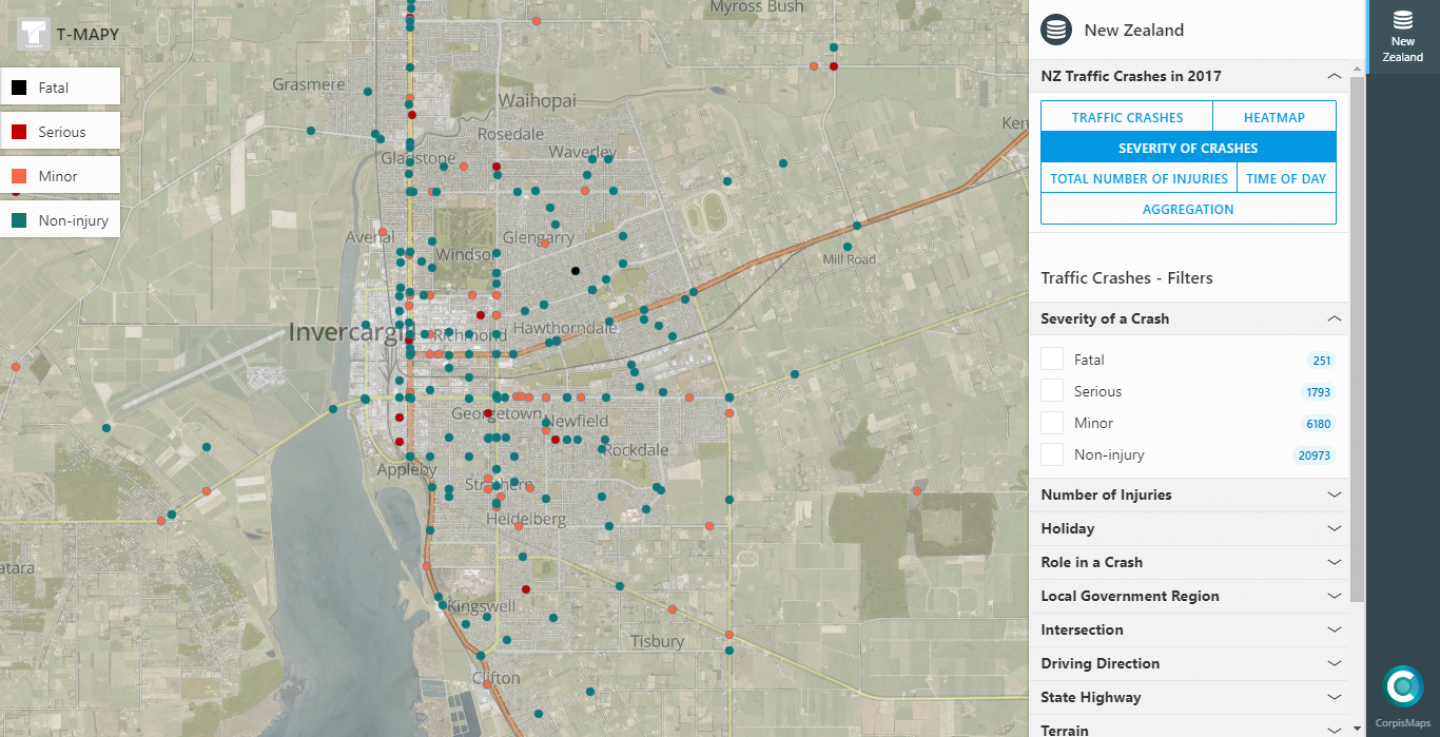
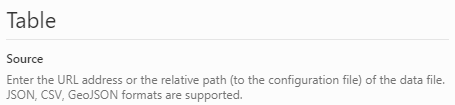
GeoJSON Support
GeoJSON format support means the instant access to wide range of data from the GIS systems and Spatial Asset Management systems including T-MAPY Assetino Professional and Premium. It has never been easier to create custom spatial analyses of your assets for decision makers.

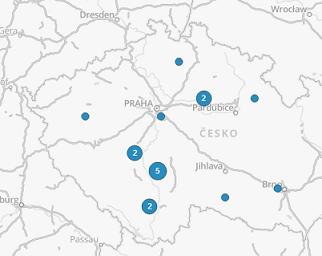
Other Features and Improvements
Vector basemap support, Corpis Maps Creator user interface improvements, identification by tokens, performance improvements.


All Corpis Maps Integration Partners, Solution Partners and clients have immediate access to this new version of Corpis Maps. For more information about Corpis Maps or live demos, visit the official product website:


Are you interested in a Corpis Maps demo with your own data?
Contact us at marek.lesak@tmapy.com (Marek Lesak).

su pro workshop

T-MAPY User Conference 2018

In early October, more than 150 users and business partners attended the annual T-MAPY conference.

21. T-MAPY Setkání uživatelů

The main theme of this year’s conference was ‘We are part of the change’. And indeed, there were many changes and updates to talk about. Assetino – our spatial asset management platform – has seen a lot of improvements this year: adjustments to the system core resulted in higher performance and the improved scalability of design provides the users with a better experience. New asset modules broaden the portfolio of areas where Assetino can be deployed – and the list of new features goes on and on. Positive reactions from the audience confirmed that we are heading in the right direction.

3
31

We are already looking forward to further improvements – whether it is IoT sensor data processing and analysis, utilizing the platform in the smart city ecosystem, or integration of the GIS, facility management, and BIM worlds. Another significant highlight of the conference was the presentation of the Corpis Maps product. This is a platform for visualization and analysis of spatial data from diverse sources. Conference attendants appreciated the universal potential of Corpis Maps, the simplicity and speed of analytical maps configuration, and the maximum data security.

39
4

After spending two days immersed in the specialized events, the attendants returned back to their homes full of new impressions, experiences, and energy for their new projects.

9
91

We would like to thank all of the participants for attending and for their valued contributions to the discussion. We are thrilled to see that both the number of participants and the quality of the whole conference have increased over the years.

93
8
97
99

We are looking forward to seeing you all next year!

corpis_maps_hero

Corpis Maps v2 - Release Notes September 2018

Corpis Maps Releases Notes - September 2018

This is a huge milestone for Corpis Maps and everyone using this product!

Corpis Maps (configurable analytic map platform for business data) version 2 has been released! In the new version, we bring the whole new level of effortless and intuitive creation of a map configuration called Corpis Maps Creator. Thanks to this new functionality, Corpis Maps strengthen the leading position in location analytics and corporate geographic business intelligence solutions.

Corpis Maps Creator
The brand new visual map configuration tool makes it super easy and time efficient to create or edit configuration files of your analytic maps.

Meet the Intelligent "Form View"!
We simplified the way of creating a map configuration file. The new "Form View" enables to create a custom analytic map very easily, it leads you through the creation of the configuration file and also helps you to avoid any errors.

Form View and Code View
You can easily switch between the Form View and the Code View. It is very useful when you need to copy&paste a part of your existing configuration file (e.g. reference table) into a new one.

Configuration File Structure
Map configuration is now devided into several sections, sub-sections and items that are easily accesible in the Configuration File Structure pane. You can jump between sections with just one click.

Values in a Picklist
Some values like a data format or aggregation functions and now nicely arranged in a pickist, so your don't need to remember them. Simply choose one of them from the picklist.

Map Preview
Once you finish editing of your configuration file, you can immediately view the result in the preview mode by clicking the "Send to Corpis Maps" button. The Map Preview window located on the right side of the page.

Syntax and Configuration File Validator
This new feature is continuously validating your configuration file. If there is any error, it shows you the information in the Form View and also in the Code view where the error is in your configuration file.

Add and Remove Buttons
If you need to add or remove e.g. a new visualization or new aggregation metrics in the configuration file, you can easily do so using the blue (+) and the red (x) button.


All Corpis Maps Integration Partners, Solution Partners and clients have immediate access to this new version of Corpis Maps. For more information about Corpis Maps or live demos, visit the official product website:

corpis-maps-web

Corpis Maps - Release Notes June 2018

Corpis Maps Releases Notes - June 2018

New version of Corpis Maps (configurable analytic map platform for business data) has been released. It is better, faster, more powerful and it remains extremely secure. The latest version has many new features and improvements including:

Mobile Device Support
You can view your analytic maps on any device including mobile phones and tables.

Calculated Metrics
You can create new calculated metrics from metrics in the raw data file. It is extremely powerful feature for creation new metrics like „Revenue/Number of Visits“ or „Contracts/Number of Calls“. It works for both points and aggregations.

CSV File Format Support
Corpis Maps can now read the raw data from a CSV file, so you can choose whether you put the raw data into a JSON or a CSV (UTF-8) file.

Faster Than Ever
Corpis Maps is now faster than ever before. It includes everything from loading the app, reading the data from a raw data file to loading aggregation polygons.

Zoom In/Out Buttons
Especially useful on devices without a multitouch touchpad.

Expand All/Collapse All Buttons
You can easily expand or collapse all filters with the new buttons. In configuration you can define the default state of a filter to Expand or Collapse. You can also order the filters.

Data Series
You can use data series to see how a selected metric (e.g. revenue) changes in time. Moreover you can quickly jump between two or more data series (e.g. same month in two years) without a need to move the slider handler.

Personalization
You can personalize a Corpis Maps application with your company logo and the company name.

Search
Search now supports text and number values.

Values in the Information Panel
In configuration you can define whether a value will be shown in the Information panel of a point, polygon or both. You can also order the values in the Information panel.

Clusters
Clusters can now be optionally shown as clusters until a zoom level you define in configuration. If you zoom in even more, the points appears.

Data Attribution
You can add a text attribution with a link on the map. It will appear in the right bottom corner.


All clients have immediate access to this version of Corpis Maps. For more information about Corpis Maps or live demos, visit the official product website:

GEO18_VisitUs_1024x512_twitter

T-MAPY at GEO Business 2018 in London

T-MAPY products in London on 22 & 23 May 2018

We are going to London next week to showcase our latest products and technologies.

GEO18_VisitUs_1024x512_twitter

GEO Business (22 - 23 May) is the top European international exhibition showcasing 200+ leading geospatial companies including T-MAPY. In 2017 the event attracted more than 2,300 visitors from 52 countries. This year, it will be even more!

T-MAPY is going to one of exhibitors that will have a stand there. If you are going to GEO Business, make sure you come by the stand E3 and see the T-MAPY team and our latest innovative products.

We would like to invite you to our workshop that will start on Wednesday from 09:30 - 10:00. Room H.

If you are a mapping and surveying company, GIS consulting firm or IT consulting firm, we would like to talk with you as there is a great opportunity for you to become a reseller partner of our solutions - Assetino and Corpis Maps.

Innovative Spatial Web Asset Management

corpis-maps-web

Unique Configurable Analytic Maps

We will provide you more detailed information about these two amazing products and show you live demos at our stand E3:

GEO18_FloorplanV79

We look forward to meeting you there.

T-MAPY Team

partnership

Assetino - Chosen for Asset Management of 700+ Municipalities!

The T-MAPY Partner Network is growing. We are pleased to announce that GeoData, DATA PROCON, Geomorava, IterSoft becomes the Authorized Reseller Partner of Assetino (T-MAPY Scalable Asset Management Platform).

T-MAPY Partners

Our asset management platform Assetino has been chosen to become the new official asset management solution for more than 700 municipalities. Assetino is now used at all governmental levels from small towns to big cities and regional councils. Apart of Assetino, all of our new reseller partners provide data services including the data capture - they keep the data in Assetino up to date for their clients.

Are you interested in knowing more about Assetino?

Visit our stand or our workshop at GEO Business London on 22-23 May. The workshop "Innovative Spatial Web Asset Management System and Analytic Maps" starts on 23 May, 09:30 AM, Room H.

GEO18

New Zealand Crash Analysis - Interactive Map in CORPIS MAPS


Check out this awesome interactive analytical map that we created together with our New Zealand implementation partner Smart GIS Solutions in CORPIS MAPS.

The map shows New Zealand crash data (Crash Analysis System data) from the NZTA Open Data Portal and enables you to see crashes with all the crash details in various visualizations. All of this in the highest possible geographic detail together with a unique hybrid basemap (street + aerial basemap).

In the map, you can easily check what happened when and where, which gives you plenty of information about the crashes in your neighbourhood and knowledge for the future. When you drive or walk the crash place next time, you will slow down or be more careful when it rains.

This map helps to keep you, your family and friends safe.
Tell them about the possible traffic risks that can happen on their way to work or school.

Are you interested in CORPIS MAPS? Contact us.

About CORPIS MAPS

CORPIS MAPS is a unique configurable map application for spatial analysis of any data. The application enables intergration with other information systems (e.g. ERP/CRM/BI/E-commerce).
CORPIS MAPS becomes more and more popular because of its ease of implementation and the value of analytical information provided to the end users.
Analytical maps created in CORPIS MAPS are used in many ways - in most cases as a Corporate Geographic Business Intelligence system that helps businesses to analyze their sales results and potential spatially in order to get more insight and knowledge of the market, clients, potential - this knowledge has a significant impact on their sales growth and overall success in the market.

About T-MAPY

Founded in 1992, T-MAPY has grown to become a key provider of geospatial solutions. Our extensive know-how and experience in geoinformatics, information technology, geography, cartography, data processing and analysis and much much more allows us to design and develop standalone geospatial solutions for public administration, emergency services, transportation, and the private sector.

Introducing Smart GIS Solutions, the new T-MAPY Reseller Partner in New Zealand

The T-MAPY Partner Network is growing. We are pleased to announce that Smart GIS Solutions becomes the Authorized Reseller Partner of T-MAPY geospatial solutions in New Zealand.

Because of highly innovative approach, T-MAPY products (Web GIS Asset Management System, Analytical maps, Crowdsourcing application, Vehicle Tracking application, etc.) are getting more and more popular around the world.

„We chose Smart GIS Solutions for their excellent Geospatial knowledge, long experience in the New Zealand GIS industry and customer-oriented approach. We believe that Smart GIS Solutions team expertise together with T-MAPY products will exceed expectations of New Zealand organizations,“ said Jaroslav Polacek, Product and Partner Manager at T-MAPY.

„Smart GIS Solutions is a geospatial company providing location-based solutions to better map and interpret data. Amongst the capabilities on web GIS technologies and spatial data management/analysis, Smart GIS Solutions will utilize T-MAPY products to provide cutting-edge geospatial solutions for both governmental and private sectors, " said Reza Kalbasi and Kevin KL Chan, Directors of Smart GIS Solutions.


About Smart GIS Solutions

Smart GIS Solutions was founded in 2017 by a team of highly experienced geospatial consultants and educated GIS scientists. Smart GIS Solutions team capabilities include spatial data management/analysis, geospatial data collection, cartographic visualization, and the use of desktop, mobile and web GIS technologies. Having the experience of both governmental and private sector throughout New Zealand enables Smart GIS Solutions team to provide cutting-edge geospatial solutions to make smart decisions. Smart GIS Solutions has strong network with professionals and scientists across university academics in New Zealand, Europe and U.S.

About T-MAPY

Founded in 1992, T-MAPY has grown to become a key provider of geospatial solutions. Our extensive know-how and experience in geoinformatics, information technology, geography, cartography, data processing and analysis and much much more allows us to design and develop standalone geospatial solutions for public administration, emergency services, transportation, and the private sector. The most popular T-MAPY geospatial product is highly innovative Web GIS Asset Management System.

Visit T-MAPY website: https://www.tmapy.com/

Copyright © 2024 | T-MAPY spol. s r.o.