mam

T-MAPY takes part in the development of GIS in Moldova

T-MAPY, together with the GEOtest company, is working on a project which supports the implementation of a regional strategy by using GIS data in Moldova. The entire project has shifted into its second half both time-wise and process-wise, and we are happy to share the results it has achieved so far.

czech rep development_mini

The first trip we undertook was in the fall of 2018. Since then, we have visited Chisinau and its surrounding regions several times. We were able to analyze the situation in SDI (Spatial Data Infrastructure) by conducting a complex survey.

We addressed 90 institutions in total; these included all ministries as well as most government organizations, scientific institutions, universities, and non-government organizations. Our goal was to evaluate the current expertise and technical background as well as identify existing geodata in Moldova. We found that basic geodata was of excellent technical quality, yet if updates are not ensured, the data cannot be used as a reference for follow-up thematic data. Currently, the pillar grasped in the most complex way from conceptual, legislative, as well as the implementation point of view includes metadata, the geoportal, and network services.

v HK_mini
random_mini

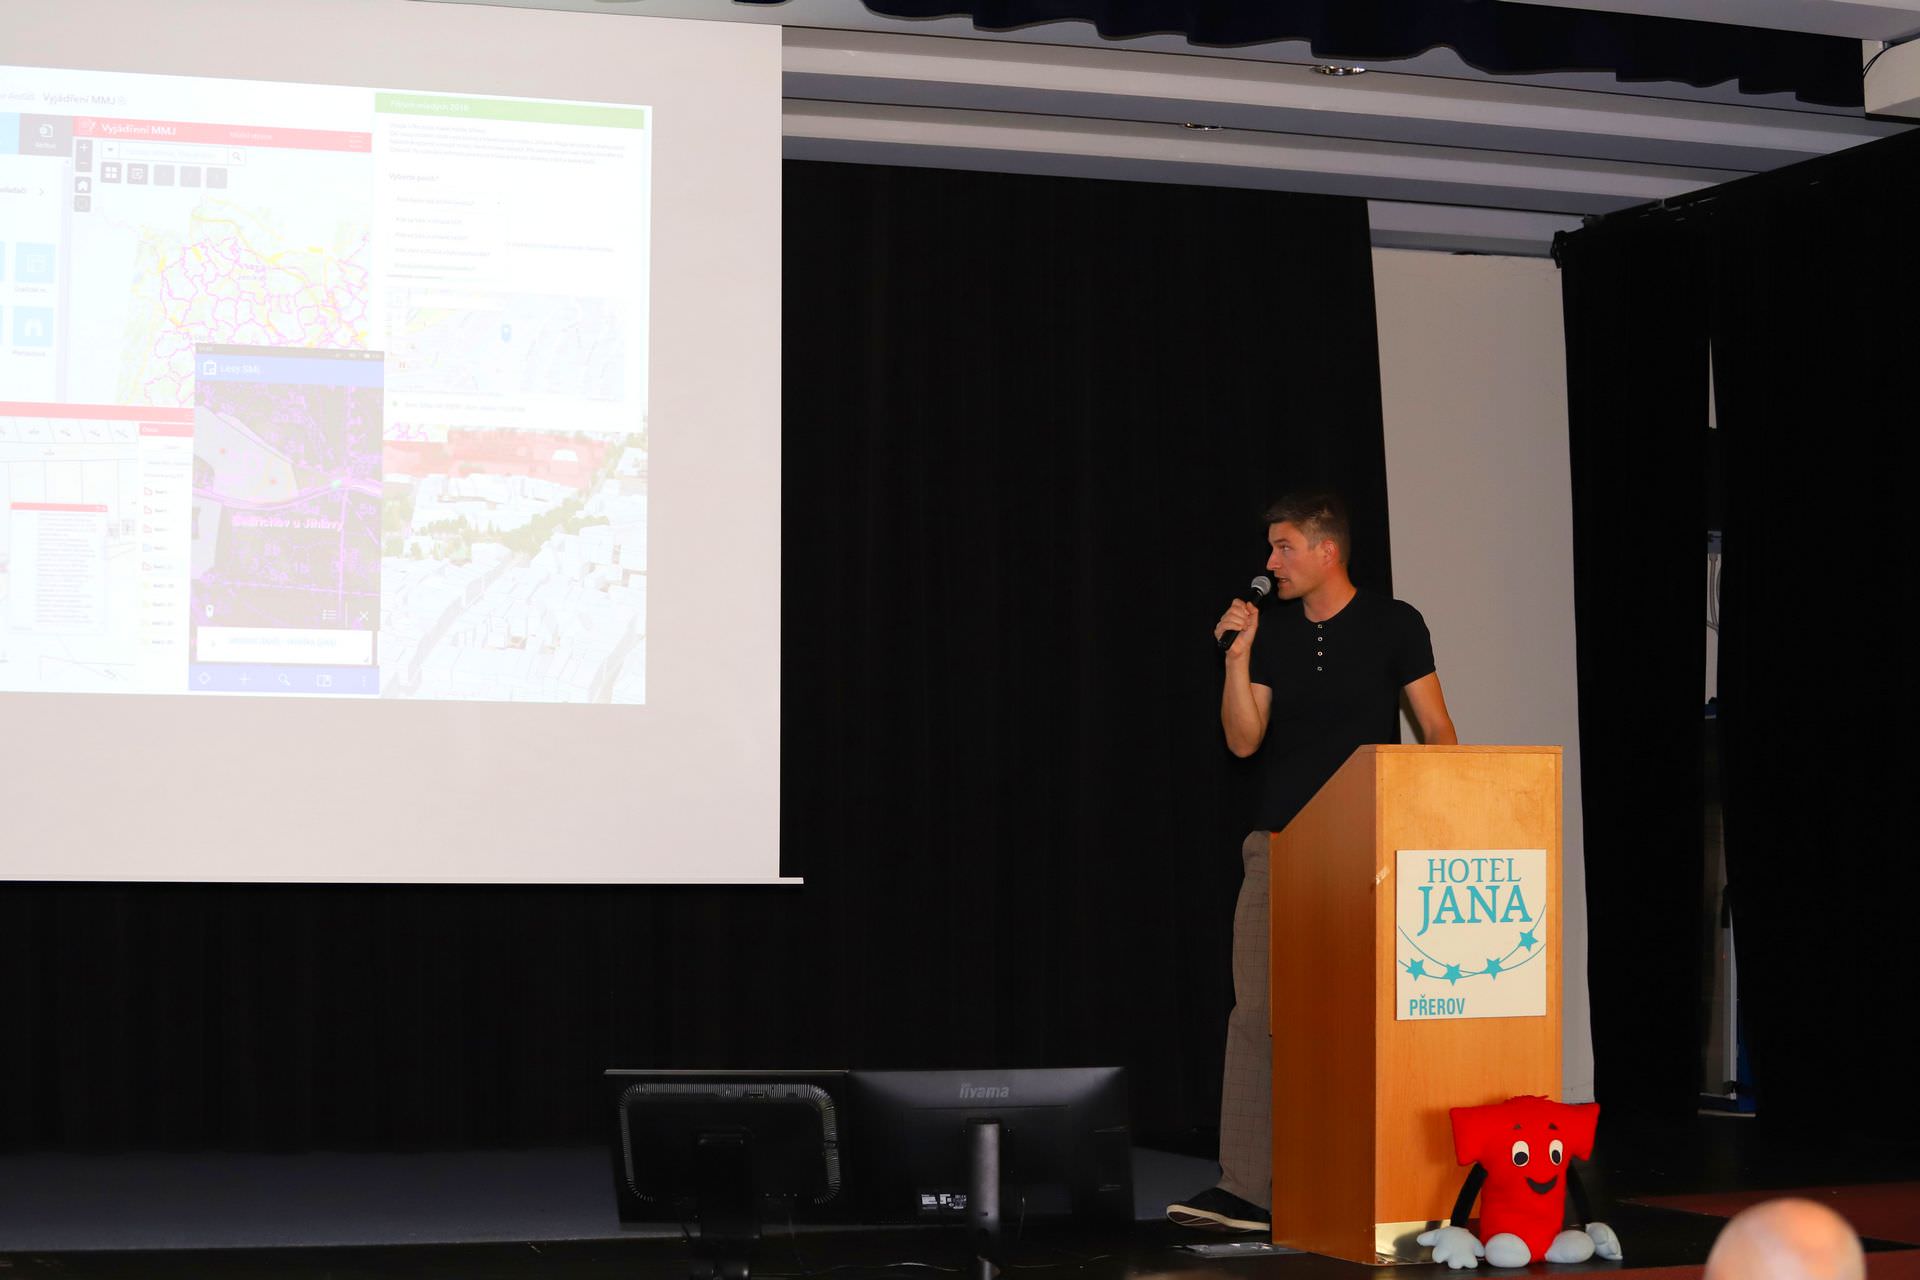
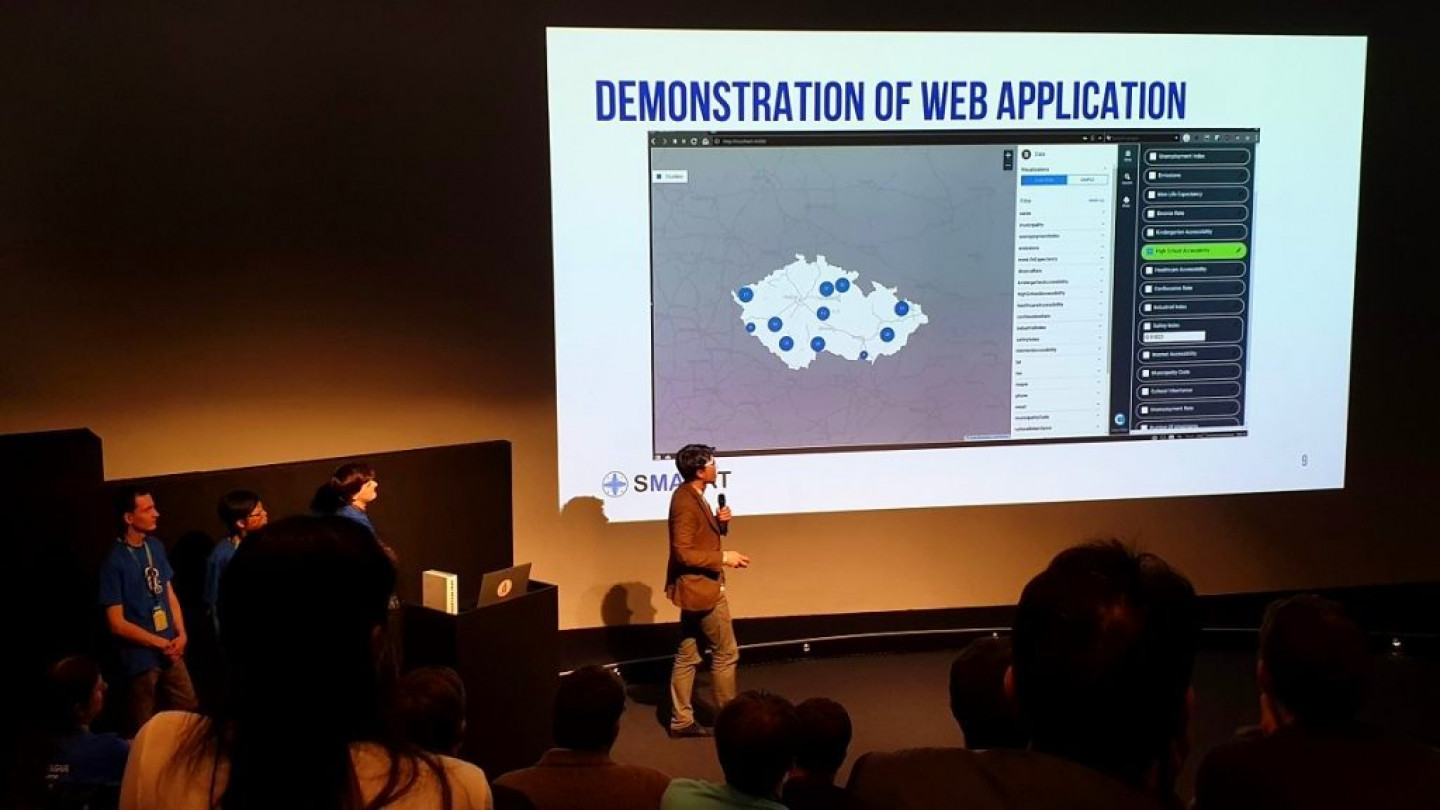
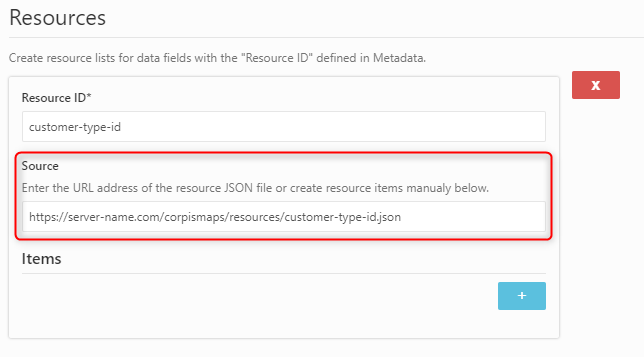
On the other hand, the competence and development of human resources represent one of the weakest aspects of the current situation. The high fluctuation of qualified workers, their insufficient numbers in public administration, and a lack of a lifelong education system paralyze many activities, including the integration of the geoportal and the open data portal. Regarding thematic data, we evaluated its condition, type of distribution, and compliance with standards, and we conducted an assessment of needs and of interest in missing spatial information.

We fused all of this information together into a demonstration of a simple map application and into our EDAS metainformation system.

random2_mini
IPR_mini

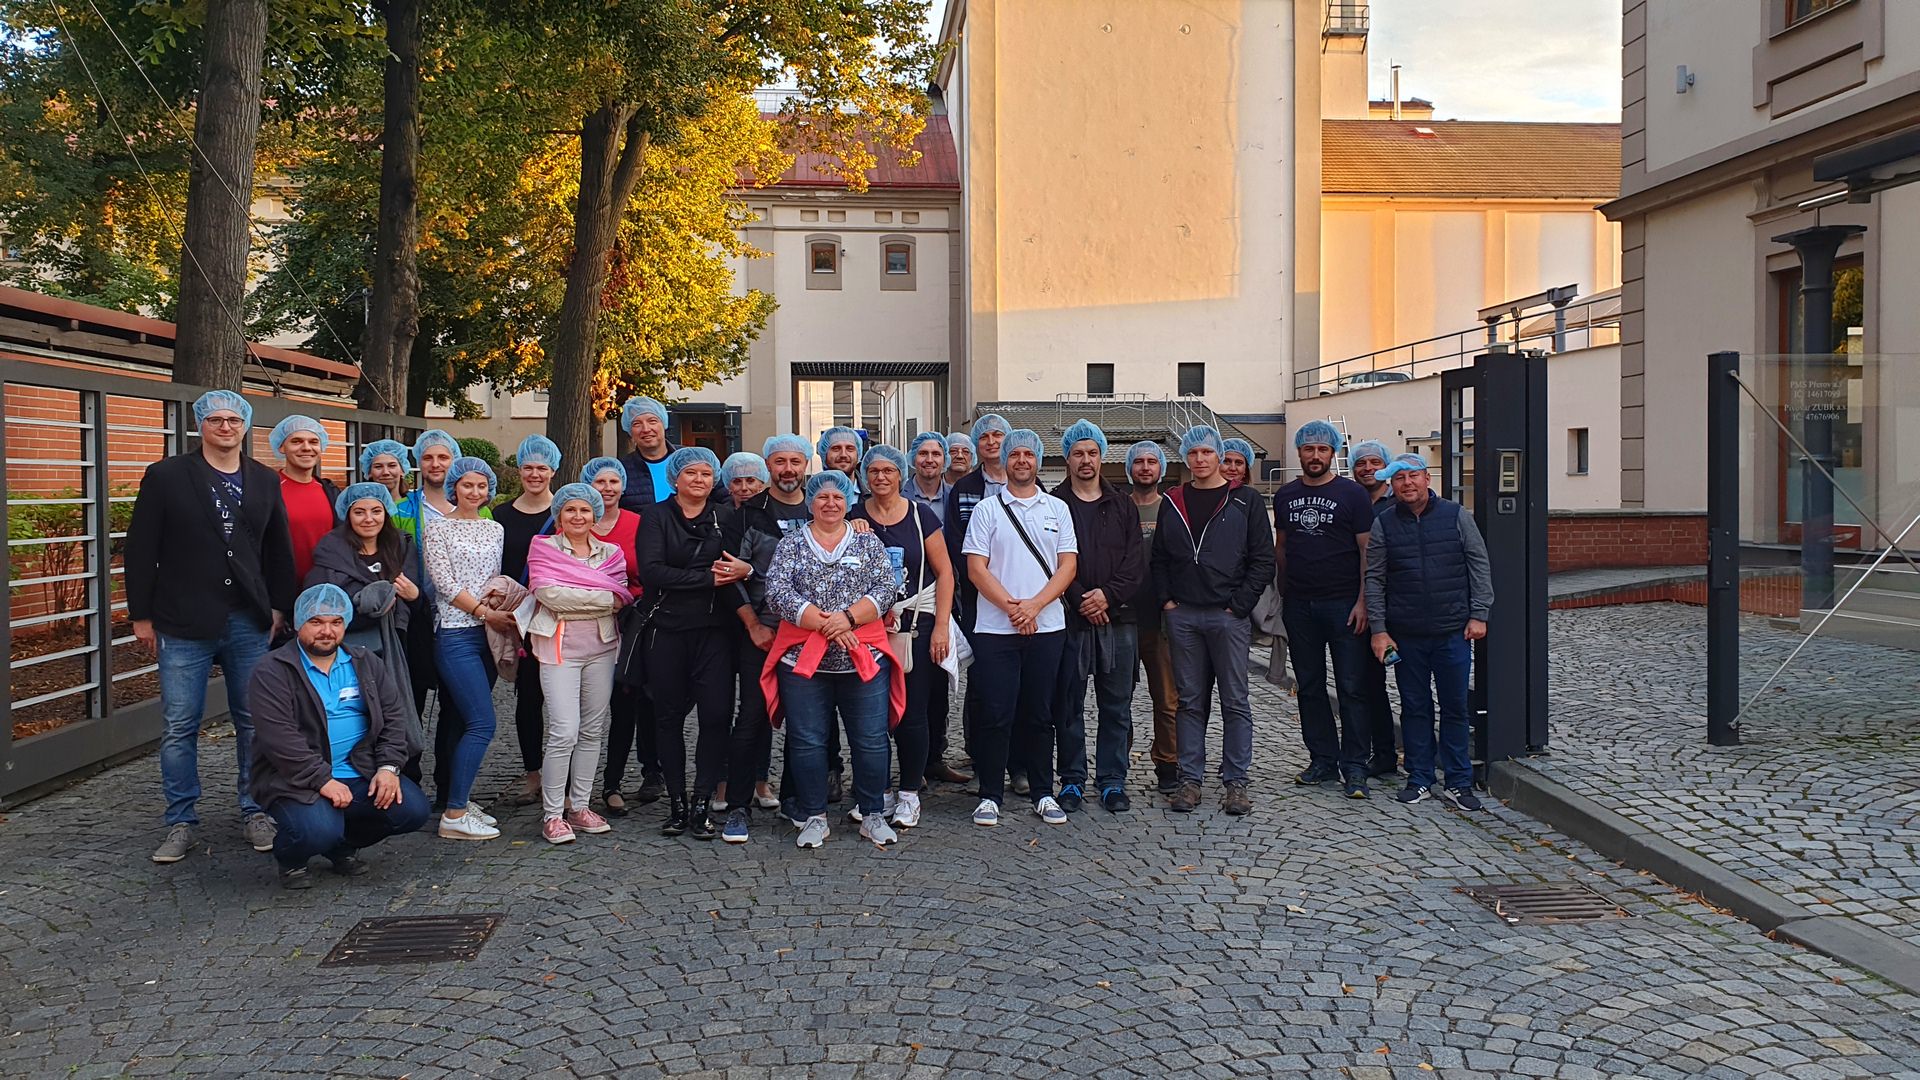
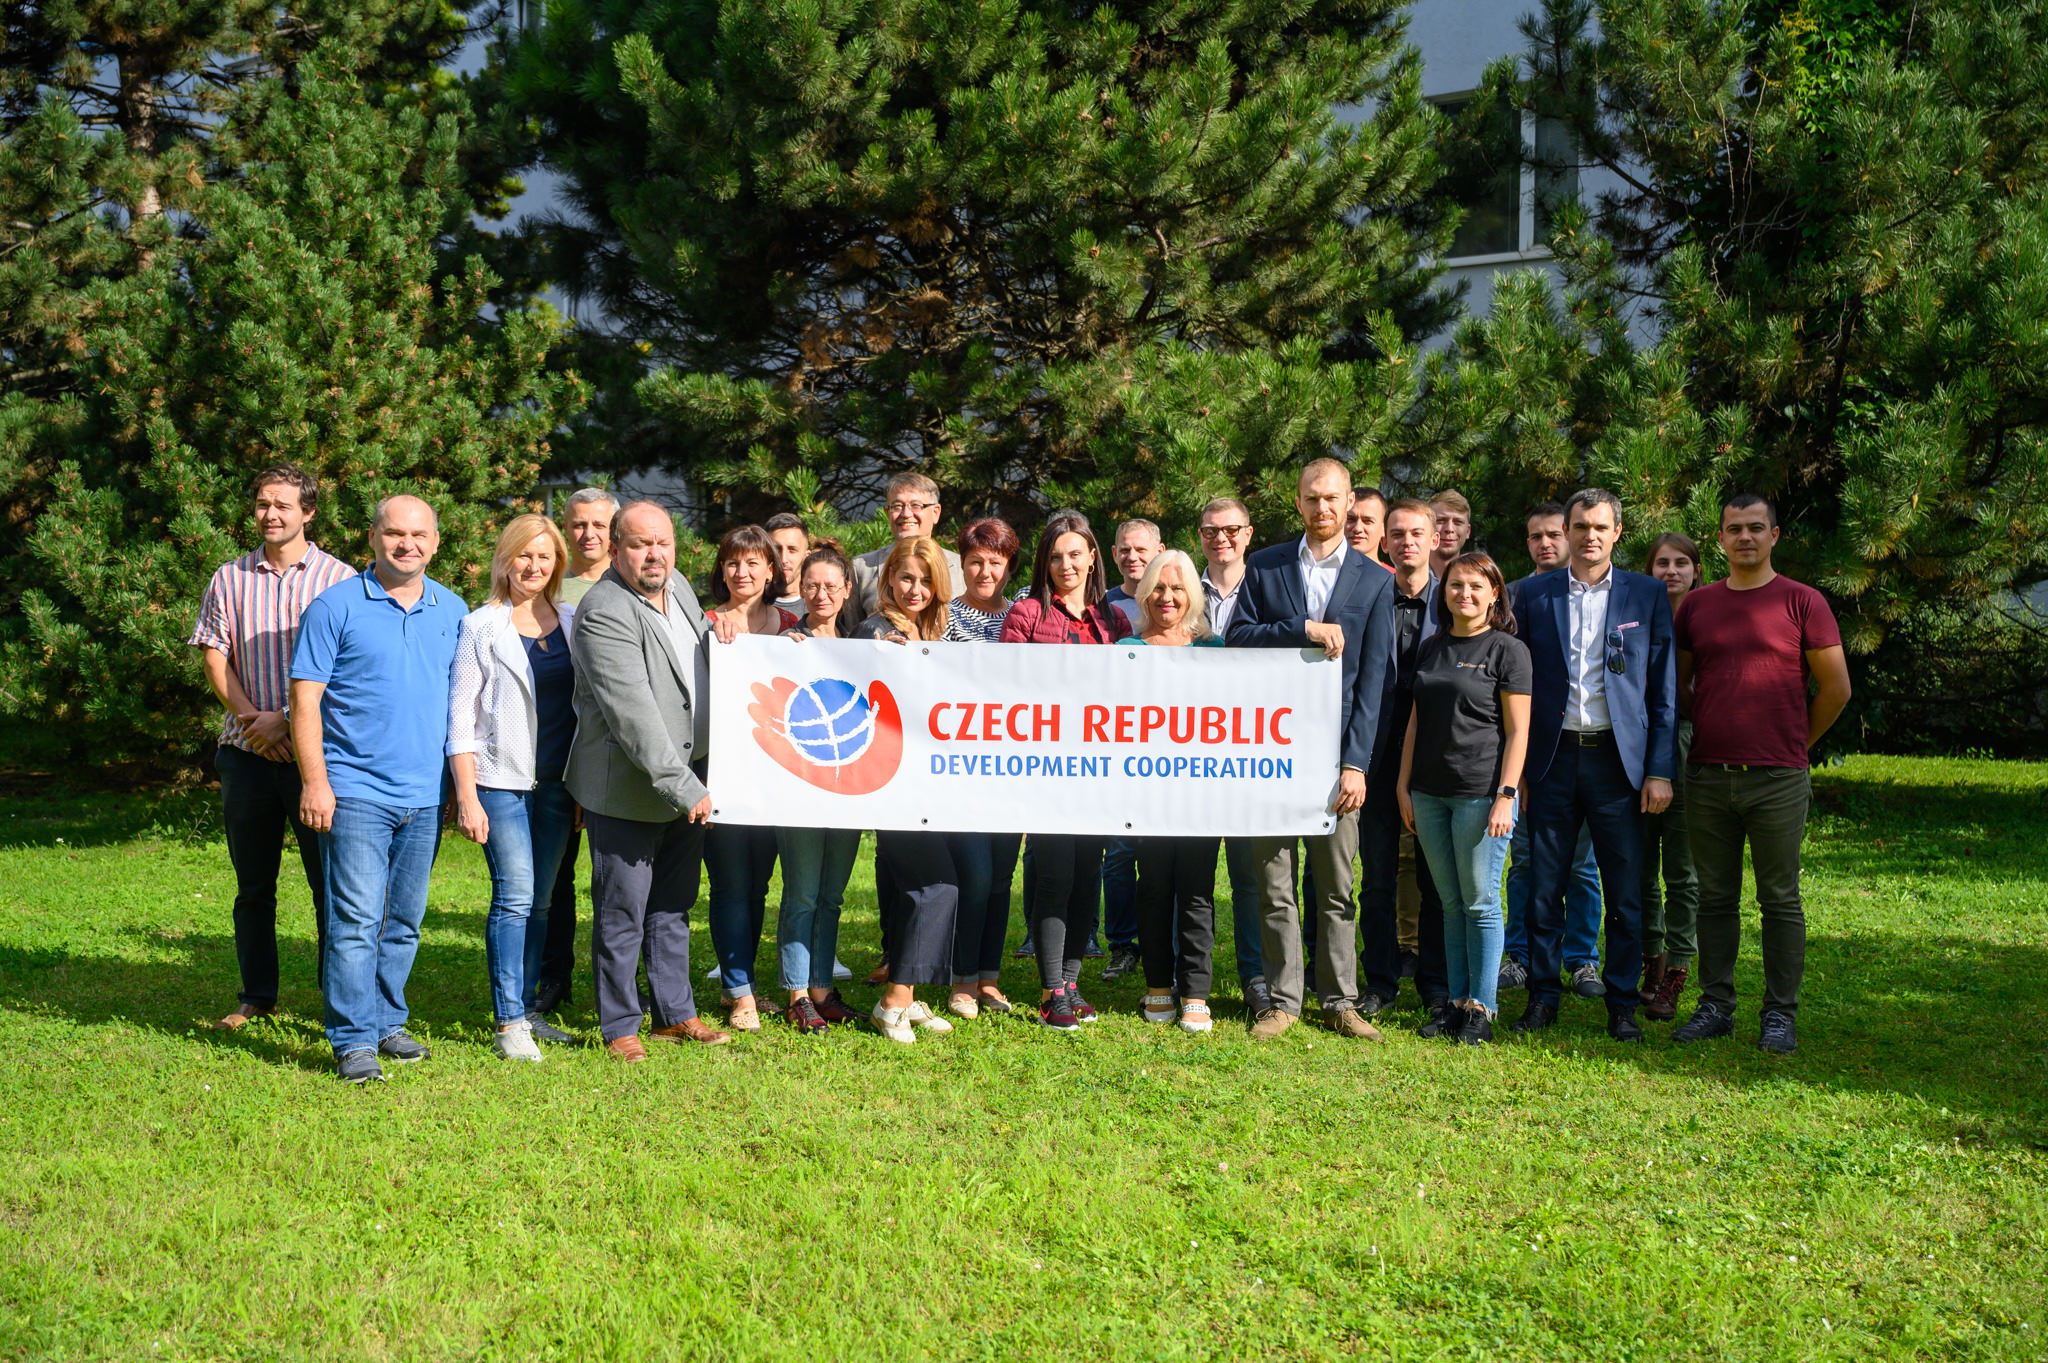
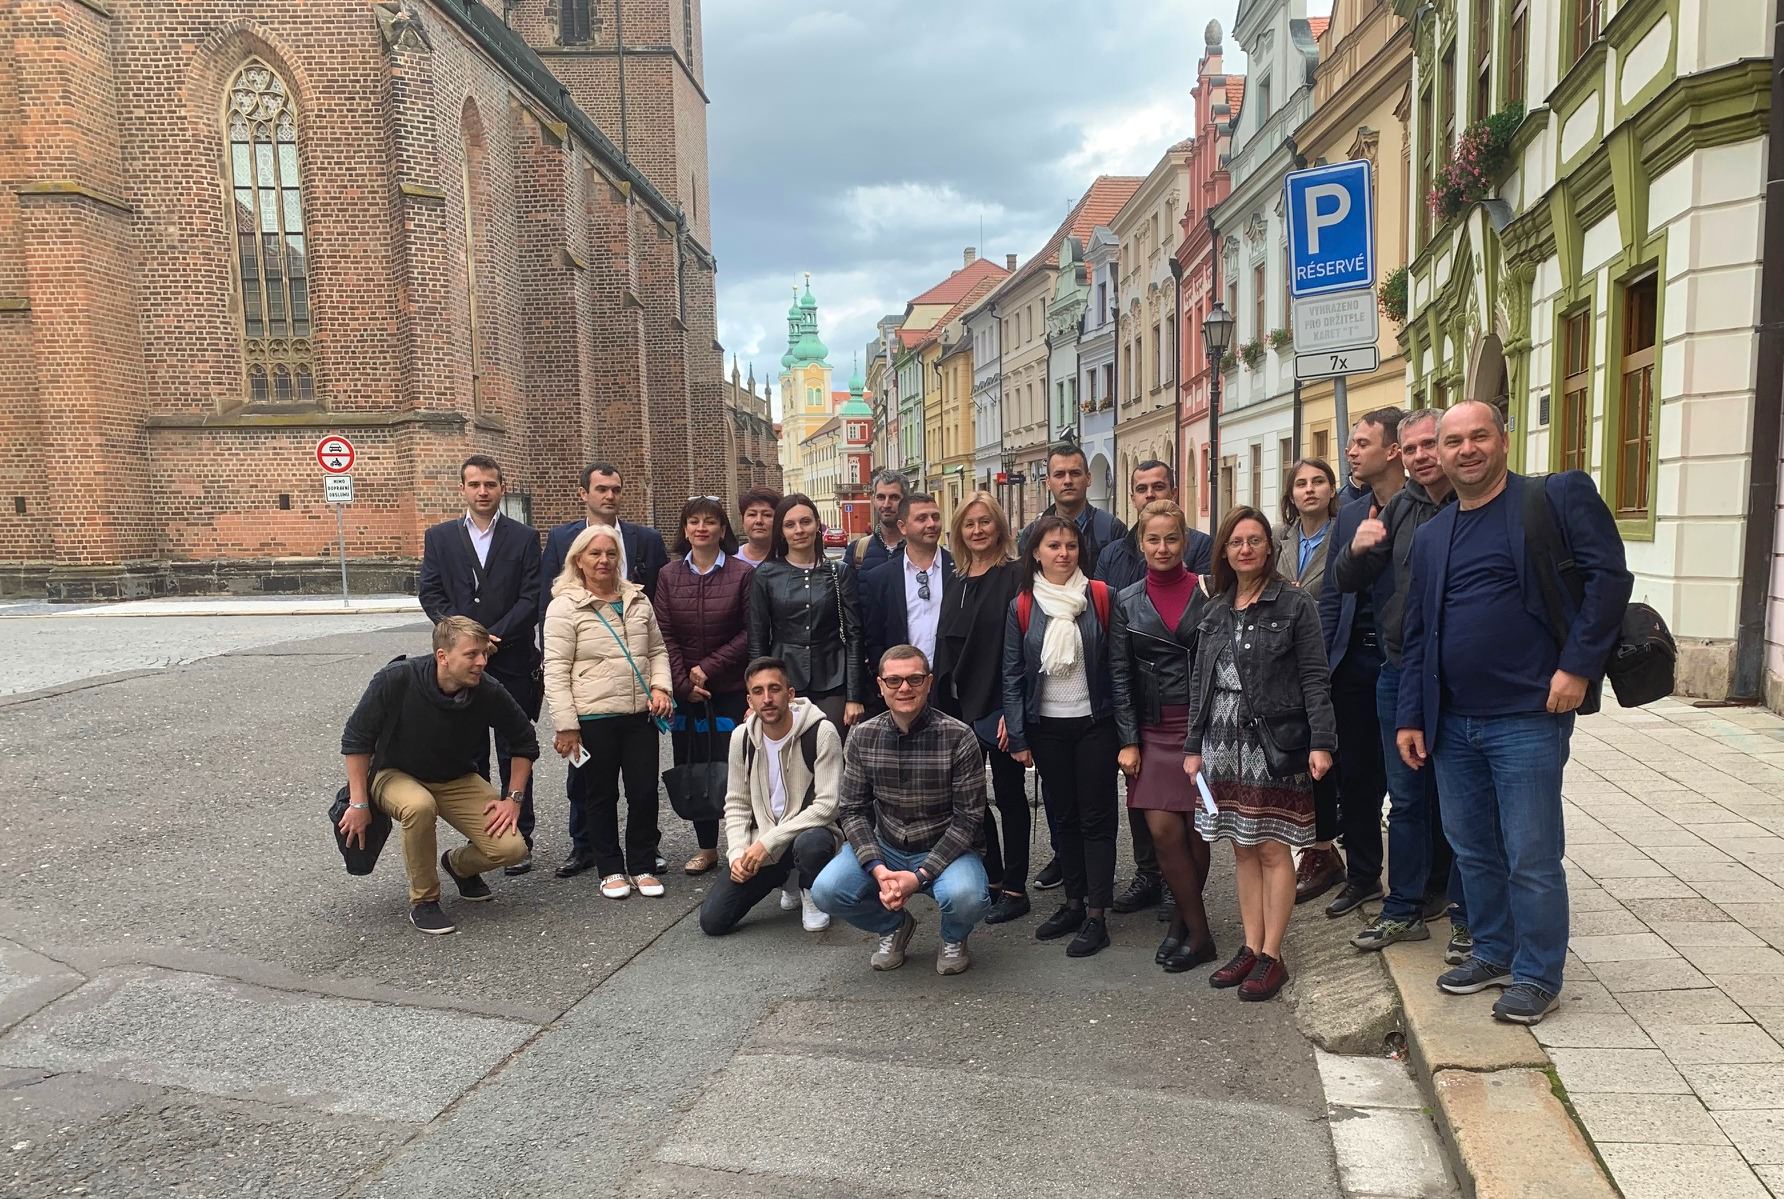
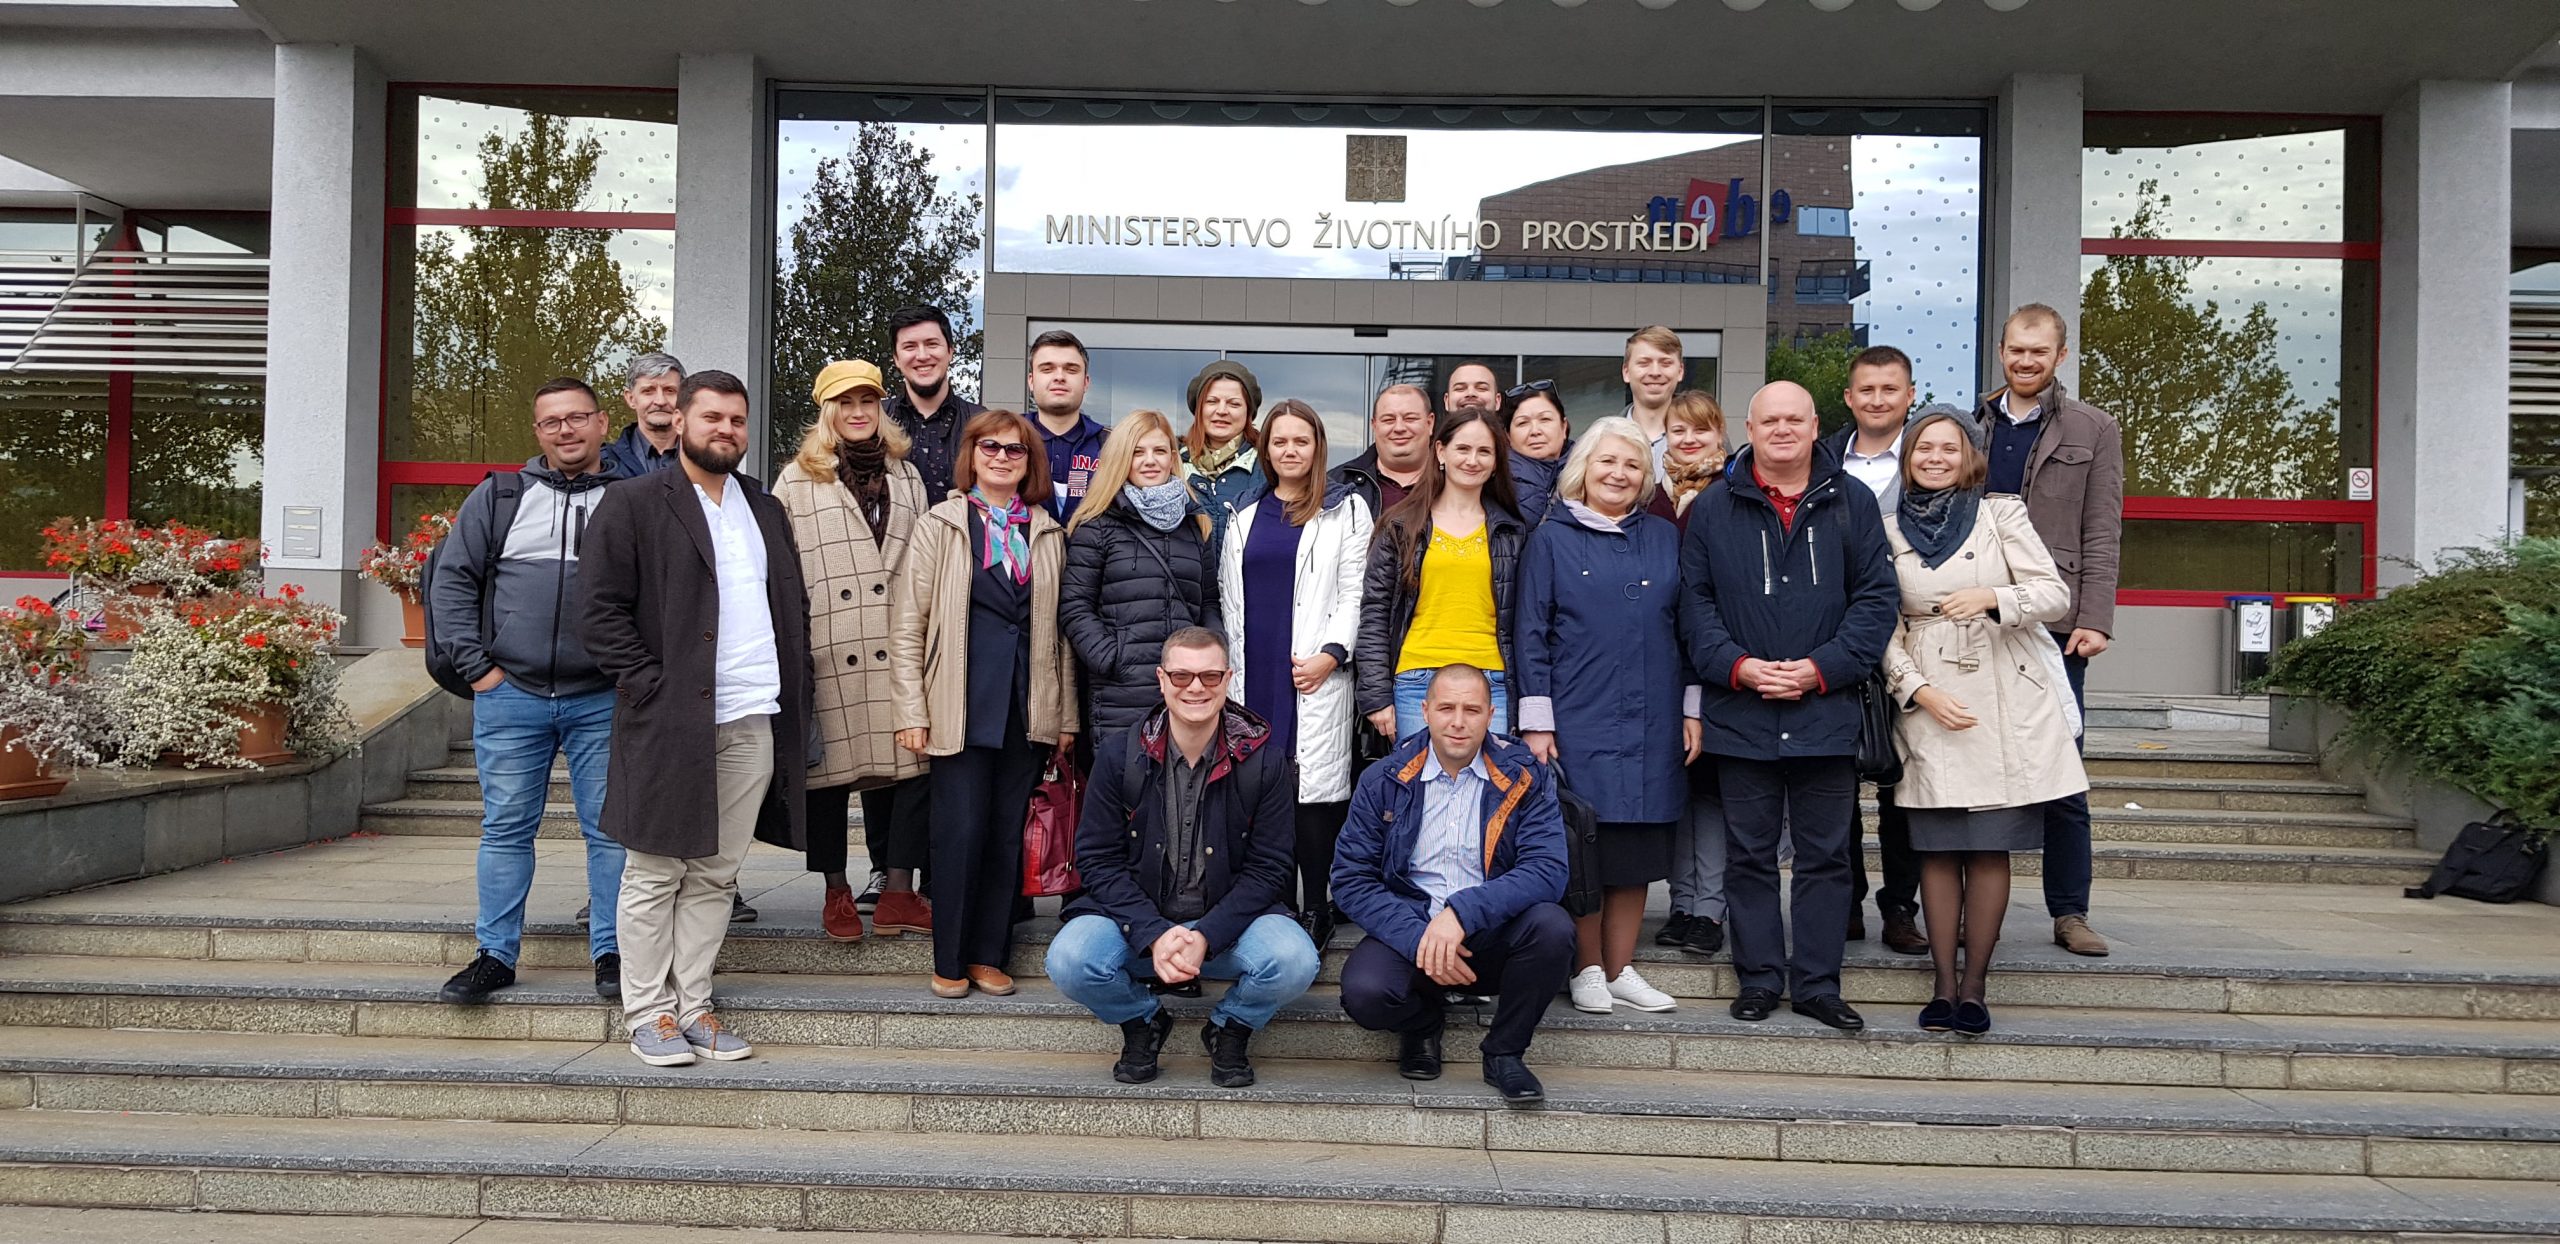
Another integral part of this project was conducting numerous GIS training sessions, under the wings of the GEOtest company. These continue to take place at regional agencies, the land cadaster agency, and the Ministry of agriculture, environment, and regional development. The training sessions culminated in a professional tour around the Czech Republic. In total, 42 Moldovan visitors travelled to Brno, Hradec Králové, and Prague. The institutions they visited included the Masaryk University, the Municipal Authority of Brno, the Municipal Authority of Hradec Králové, the Institute for Planning and Development of Prague, the Czech Information Agency for the Environment, and finally a visit to the Czech Development Agency.

ŽP_mini

The key outputs of the project include an analysis of legislative documents, methodologies, and binding documents. While analyzing the current state of the national spatial data infrastructure of Moldova, a total of six legal bottlenecks were discovered. The goal of the proposed legislative measures is to contribute to an increased quality of Moldovan legislation in the spatial data area. At the same time, the proposals for legislation revisions/amendments represent inputs for emerging Moldovan national strategy on spatial information.

Corpis Maps Portal Hero

Introducing New Corpis Maps Portal and Corpis Maps Studio!

New version of Corpis Maps has been released.

“In last months, we have been working hard on the most important innovation in the history of the Corpis Maps product. Our goal was to create a single place which will enable simple creation of analytical maps and comfortable sharing in an organization or with the public. The result is the all-new Corpis Maps Portal and Corpis Maps Studio, that will help you to utilize maximum from the power of analytical maps in the private and public sector.”

japo_xicht

Jaroslav Polacek

Corpis Maps Product and Partnership Manager

Map and User Management in Corpis Maps Portal

In Corpis Maps Portal, you can create analytical maps and usersof two types (Administrator, Viewer), each type has specific rights. An “Administrator” has the right to create and edit analytical maps and users. A “Viewer” has the right to view maps that are assigned to him/her.

users

New Corpis Maps Studio

Corpis Maps Portal contains the new Corpis Maps Studio (formerly known as Creator), where you can simply create and share your analytical map without the need to know any programming language. All important features are immediately accessible together with the live preview of the map you are just creating.

Studio

Drag and Drop Data Upload

When creating a map, you can now upload data (CSV or JSON format) directly by selecting a file from your computer or drag the file to the drop zone. It is so easy! If you prefer to read the data from a URL address, it is available too.

drag_and_drop

Ready to Use Aggregation Polygons and GeoEnrichment Data

From now, you will never need to think about how how to create aggregation polygons (districts, regions, etc.) for your country, we did it for you. Simply choose the right one from the list. Use the same way to enhance your map wit statistical data in the GeoEnrichment section. Number and areas of these datasets will be growing based on your ideas and needs.

GeoEnrichment

Map Sharing

Every map in Corpis Maps Portal can be shared across your organization or with the public (including iframe). When configuring a map, click the “Share” button and select, who will have access to the map.

Map Sharing

More information about Corpis Maps Portal and Corpis Maps Studio

All features of new Corpis Maps Portal will be described in detail on our Blog.

Availability

All Corpis Maps Integration Partners, Solution Partners and clients have immediate access to this new version..

Are you interested in a Corpis Maps demo map containing your own data?

Would you like to integrate Corpis Maps into your product (CRM, ERP, E-commerce, …)?

hero

T-MAPY User Conference Attracts Record Numbers of Asset Management Professionals

Nearly 160 asset management professionals, representing more than 60 organizations, came together in Prerov, Czech Republic to discuss industry trends such as data driven decision making, SMART Cities and IoT integration. Meeting at the T-MAPY annual user conference, delegates from government organizations mixed with retail, public transport and emergency services professionals to discover the latest developments in geoinformatics and were presented with updates on the award-winning Assetino Asset Management software.

Image00001
Image00004

Delegates at the two day event had a choice of around forty sessions to attend with options including Assetino demonstrations, customer experience presentations and an overview of T-MAPY’s activities in its role as the leading architect of digital technical mapping in the Czech Republic.

Image00002
Image00006
Image00005
Image00008

Assetino presentations included new module demonstrations; Waste, Cemeteries, Water and Sewage and others, new platform features including smart asset management tools and advanced asset analytics as well as solutions for GeoBIM and GeoFaM (geo-enabled Facilities Management). Assetino customers also delivered examples of Assetino implementations and in-use projects, complete with positive user experience and market feedback.

Image00011
Image00003
Image00012
Image00013

“It is always exciting to bring together professionals who have a diverse a range of backgrounds and operating sectors but all have one thing in common,” commented Milan Novotný, CEO of Czech based T-MAPY the company behind Assetino. “For us it’s all about location; locating assets, locating customers, locating service users. This conference clearly demonstrated that if you can accurately record, manage, analyse and present detailed locational information, using Assetino for example, then you can improve decision making and service delivery.”

5555
Image00009

Recently ranked in the top ten asset management solutions in Europe the Assetino product suite includes easy to use tools for collecting, recording, interrogating and analysing detailed information about the location, type and condition of virtually any asset. Offering a geospatial approach to asset management, Assetino provides users with real time visibility and intelligence for a range of applications including cemetery management, waste and recycling, water and sewage and others.

Image00007
0070-SU2019_min
Image00010
Image00015

In fact, the Assetino product suite contains more than a dozen easy to use, configure and integrate modules including Public Lighting, Roadways and Communications, Street and Park Equipment, Monument and Advertising, for example. And, as demonstrated at the user conference, Assetino is already supporting informed decision making and improved service delivery and reaping benefits for thousands of users within public sector organizations across Central and Eastern Europe.

6666-min
7777-minnn
Image00014
Image00016
cio

Assetino Awarded in Top 10 Asset Management Solutions

In strong competition, T-MAPY's product Assetino has received a prestigious Top 10 Asset Management solution providers 2019 award from CIO Applications Europe. Read more about T-MAPY’s Assetino platform.

Solutions Logo

Assetino platform has innovation, configurability and scalability in its DNA. Thanks to these characteristics, it enables to create comprehensive asset management apps for any asset.

Assetino contains approximately 15 modules for various industries (Municipalities, Waste management, Electric, Water, and Sewerage, etc.) Our new challenge is the integration of GIS and systems for Computer Aided Facility Management (CAFM), which provide critical information about the structure/building throughout the whole life cycle.

Assetino platform is currently used by over 1 000 customers, from small municipalities and companies to large organizations.

Certifikát CIO Applications Europe
cm3

Corpis Maps at HackPrague 2019

HackPrague is a premier annual hackathon in Prague (CZ) bringing more than 150 developers and designers from across Europe together to build their ideas. This year the organizers decided to go with one main challenge: “Use available data to improve the quality of life in cities”.

Corpis Maps became a technology partner of HackPrague and the platform was available to all teams during the whole event. Corpis Maps Product Manager Jaroslav Polacek was nominated for HackPrague as a geospatial mentor and a judge, and was helping the teams with their innovative projects.

cm1
cm2

SMAPRT team decided to use Corpis Maps as their main visualization tool because of these reasons:
– possibility of integration with their analytical solution
– ease of use
– various map visualizations
– configurability
– because they were under time presure and Corpis Maps allows to create analytical maps very quickly using the Corpis Maps Creator (visual configurator)

cm3

Their project (clustering of the Czech municipalities based on the custom combination of various parameters) was very successful and they won the 5th place in strong competition.

cm4
E3-1024-512

T-MAPY at GEO Business 2019 in London

We are going to London in May to showcase our latest products and technologies.

E3-240-100

GEO Business (21 - 22 May) is one of the top global exhibitions showcasing 200+ leading geospatial companies including T-MAPY. In 2018 the event attracted more than 2600 visitors from 59 countries. This year, it is going to be even more!

T-MAPY is going to have a stand there. If you are planning to attend GEO Business, make sure you visit our stand E3 to meet T-MAPY team and to see our latest innovative products.

We would like to invite you to our workshop that will start on Tuesday 21 May at 12:30 (Theatre 4).

Come and see our unique innovative spatial web asset management platform Assetino. Come to see real indoor and outdoor use cases from different industries.

Innovative Spatial Web Asset Management

We will introduce you to record, manage and maintain your asset data: communications, greenery, lighting, utilities, street furniture, cemeteries, waste, monuments, water supply and sewerage systems etc.

If you are a mapping and surveying company, GIS consulting firm or IT consulting firm, we would like to talk with you as there is a great opportunity for you to become a reseller partner of our web asset management platform - Assetino.

Assetino

We will provide you more detailed information on our amazing platform and show you live demos at our stand E3.

We are looking forward to meeting you there.

T-MAPY Team

Do you want to arrange a meeting with us during the event?
We would love to have a chat!
Drop us a line at info@tmapy.com

corpis-maps-web

Corpis Maps 4.0 – Release Notes February 2019

Corpis Maps - Release Notes - February 2019

Corpis Maps 4.0 has been released. This page summarizes the major features and improvements of the release, and provides links to additional information or live demos when available.

"Corpis Maps 4.0 unlocks the door of business data spatial analytics to all businesses including those from the SME (Small and medium-sized enterprise) sector. No matter how large their business is, they can benefit from the information provided by analytical maps. In Corpis Maps, you can choose whether you want to store your business data on your own server, on the new Corpis Maps Drive or on Amazon AWS and Microsoft Azure cloud platforms." said Jaroslav Polacek, Corpis Maps Product Manager.


Introducing Corpis Maps Drive

If you don't have your own server where you can put the data and a map configuration file of your analytical maps, it is not the problem anymore because we created Corpis Maps Drive for you. It is a free of charge secured cloud storage for all your analytical maps. It takes less than a minute to create a connection to Corpis Maps Drive in Windows OS and macOS.


Amazon Web Services (AWS) and Microsoft Azure Support

Corpis Maps in now compatible with AWS and Azure. If you use these two popular cloud platforms to run your apps or store files, Corpis Maps can be easily integrated into your apps or it can read the data from the cloud.


Timeline support for the "Values" type of visualization

The new feature enables to use coded values (e.g. 1 = "Contacted", 2 = "Visited", ..) together with the timeline, which is very useful e.g. for sales team performance analyses from the internal CRM system data.


Heatmap Density Slider

If the heatmap contains lots of data, it is often almost impossible to use it for analysis, because the whole map has the same color (red). We created a slider that keeps the 100% of the heatmap information value.


External Resource Files

If you use coded values (e.g. 110 = "Branch 110 - London") in Corpis Maps Creator, now you can keep the list of coded values in a separate JSON file, independent from the configuration file. In the map configuration file, you can now use links to the data file and resources files (these files can be updated as often as needed without a need to update the config file).


New Search

Search by more than one field listed in the Metadata section in Corpis Maps Creator enables very comprehensive search results. The same fields (e.g. Company Name, License Type, E-mail Address) are shown in the search results.


Chart Min and Max Values

If you prefer custom values (can be used for example for easier evaluation or data comparison of two charts in the Info Panel), rather than automatically chosen values, you can now define the Minimum and Maximum values in Corpis Maps Creator.

chart-min-max2


Hyperlink Alias

If a URL address in the source data is too long, complicated or just shouldn't be directly visible to users, you can now replace it with a new string (alias) in Corpis Maps Creator.


Other Improvements and Enhancements

Smart Migration (fully-automated upgrade of a configuration file created in earlier version of Corpis Maps to the latest one), Corpis Maps Creator (various visual and functional enhancements), Map and Print window (visual improvements), Mobile version (more intuitive point and polygon selection from the map).


Availability


All Corpis Maps Integration Partners, Solution Partners and clients have immediate access to this new version. For more information about Corpis Maps, visit the product website or contact us directly at info@corpismaps.com.


Are you interested in a Corpis Maps demo map containing your own data? Contact us at info@corpismaps.com.

su pro workshop

T-MAPY User Conference 2018

In early October, more than 150 users and business partners attended the annual T-MAPY conference.

21. T-MAPY Setkání uživatelů

The main theme of this year’s conference was ‘We are part of the change’. And indeed, there were many changes and updates to talk about. Assetino – our spatial asset management platform – has seen a lot of improvements this year: adjustments to the system core resulted in higher performance and the improved scalability of design provides the users with a better experience. New asset modules broaden the portfolio of areas where Assetino can be deployed – and the list of new features goes on and on. Positive reactions from the audience confirmed that we are heading in the right direction.

3
31

We are already looking forward to further improvements – whether it is IoT sensor data processing and analysis, utilizing the platform in the smart city ecosystem, or integration of the GIS, facility management, and BIM worlds. Another significant highlight of the conference was the presentation of the Corpis Maps product. This is a platform for visualization and analysis of spatial data from diverse sources. Conference attendants appreciated the universal potential of Corpis Maps, the simplicity and speed of analytical maps configuration, and the maximum data security.

39
4

After spending two days immersed in the specialized events, the attendants returned back to their homes full of new impressions, experiences, and energy for their new projects.

9
91

We would like to thank all of the participants for attending and for their valued contributions to the discussion. We are thrilled to see that both the number of participants and the quality of the whole conference have increased over the years.

93
8
97
99

We are looking forward to seeing you all next year!

corpis_maps_hero

Corpis Maps v2 - Release Notes September 2018

Corpis Maps Releases Notes - September 2018

This is a huge milestone for Corpis Maps and everyone using this product!

Corpis Maps (configurable analytic map platform for business data) version 2 has been released! In the new version, we bring the whole new level of effortless and intuitive creation of a map configuration called Corpis Maps Creator. Thanks to this new functionality, Corpis Maps strengthen the leading position in location analytics and corporate geographic business intelligence solutions.

Corpis Maps Creator
The brand new visual map configuration tool makes it super easy and time efficient to create or edit configuration files of your analytic maps.

Meet the Intelligent "Form View"!
We simplified the way of creating a map configuration file. The new "Form View" enables to create a custom analytic map very easily, it leads you through the creation of the configuration file and also helps you to avoid any errors.

Form View and Code View
You can easily switch between the Form View and the Code View. It is very useful when you need to copy&paste a part of your existing configuration file (e.g. reference table) into a new one.

Configuration File Structure
Map configuration is now devided into several sections, sub-sections and items that are easily accesible in the Configuration File Structure pane. You can jump between sections with just one click.

Values in a Picklist
Some values like a data format or aggregation functions and now nicely arranged in a pickist, so your don't need to remember them. Simply choose one of them from the picklist.

Map Preview
Once you finish editing of your configuration file, you can immediately view the result in the preview mode by clicking the "Send to Corpis Maps" button. The Map Preview window located on the right side of the page.

Syntax and Configuration File Validator
This new feature is continuously validating your configuration file. If there is any error, it shows you the information in the Form View and also in the Code view where the error is in your configuration file.

Add and Remove Buttons
If you need to add or remove e.g. a new visualization or new aggregation metrics in the configuration file, you can easily do so using the blue (+) and the red (x) button.


All Corpis Maps Integration Partners, Solution Partners and clients have immediate access to this new version of Corpis Maps. For more information about Corpis Maps or live demos, visit the official product website:

corpis-maps-web

Corpis Maps - Release Notes June 2018

Corpis Maps Releases Notes - June 2018

New version of Corpis Maps (configurable analytic map platform for business data) has been released. It is better, faster, more powerful and it remains extremely secure. The latest version has many new features and improvements including:

Mobile Device Support
You can view your analytic maps on any device including mobile phones and tables.

Calculated Metrics
You can create new calculated metrics from metrics in the raw data file. It is extremely powerful feature for creation new metrics like „Revenue/Number of Visits“ or „Contracts/Number of Calls“. It works for both points and aggregations.

CSV File Format Support
Corpis Maps can now read the raw data from a CSV file, so you can choose whether you put the raw data into a JSON or a CSV (UTF-8) file.

Faster Than Ever
Corpis Maps is now faster than ever before. It includes everything from loading the app, reading the data from a raw data file to loading aggregation polygons.

Zoom In/Out Buttons
Especially useful on devices without a multitouch touchpad.

Expand All/Collapse All Buttons
You can easily expand or collapse all filters with the new buttons. In configuration you can define the default state of a filter to Expand or Collapse. You can also order the filters.

Data Series
You can use data series to see how a selected metric (e.g. revenue) changes in time. Moreover you can quickly jump between two or more data series (e.g. same month in two years) without a need to move the slider handler.

Personalization
You can personalize a Corpis Maps application with your company logo and the company name.

Search
Search now supports text and number values.

Values in the Information Panel
In configuration you can define whether a value will be shown in the Information panel of a point, polygon or both. You can also order the values in the Information panel.

Clusters
Clusters can now be optionally shown as clusters until a zoom level you define in configuration. If you zoom in even more, the points appears.

Data Attribution
You can add a text attribution with a link on the map. It will appear in the right bottom corner.


All clients have immediate access to this version of Corpis Maps. For more information about Corpis Maps or live demos, visit the official product website:

Copyright © 2024 | T-MAPY spol. s r.o.